Figures & data
Figure 1. Identification of the MTO cubic phases. Polarized photomicrographs of the lamellar (A) and cubic phases (B). SAXS diffraction profiles of the MTO cubic phase (C).
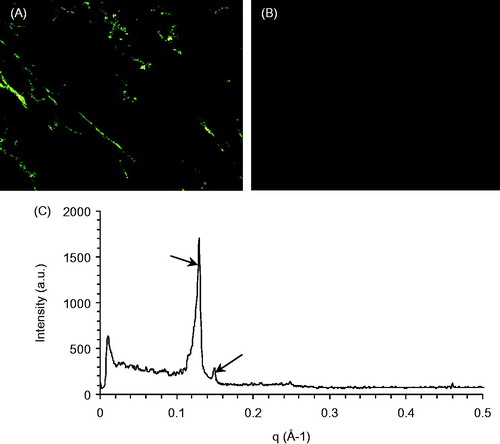
Figure 2. Cumulative amounts of MTO released from the cubic phases crossing through the rat skins as a function of time. The data are presented as the means ± SDs (n = 3).
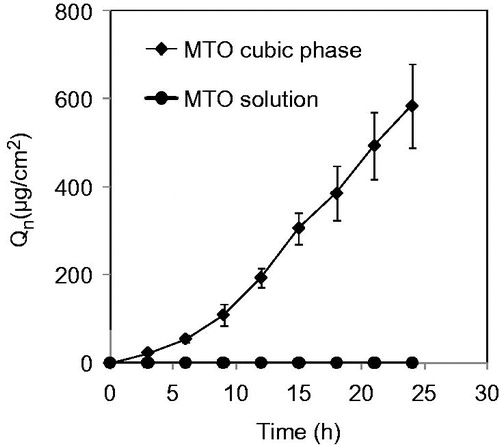
Figure 3. Design and fabrication of the modified ECIS chip and the cytotoxicity profiles of the different formulations on the B16 cells, as assessed through impedance sensing. The impedance profile data are presented as the means ± SDs (n = 3).
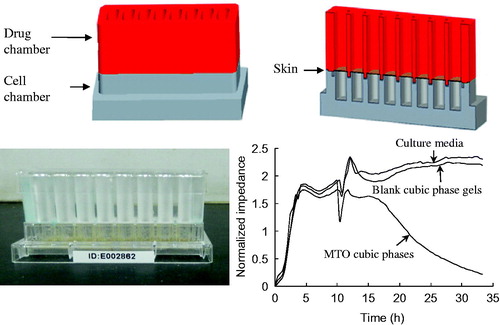
Figure 4. Profiles of the mouse tumor sizes following treatment with the MTO formulations for melanoma therapy. MTO cubic phase versus control, *p < 0.01, ** p < 0.001. MTO cubic phase versus MTO solution, #p < 0.05, ##p < 0.01. The data are presented as the means ± SDs (n = 6).
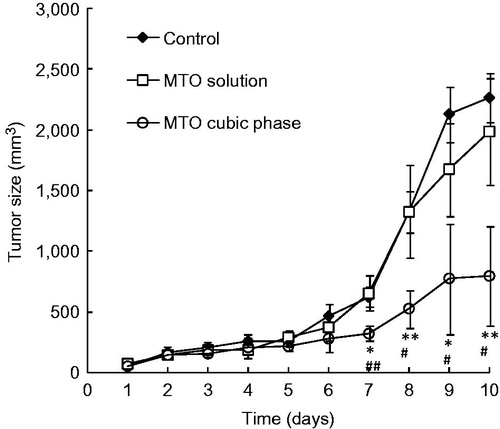
Figure 5. Images of the tumors following melanoma therapy with the MTO formulations.
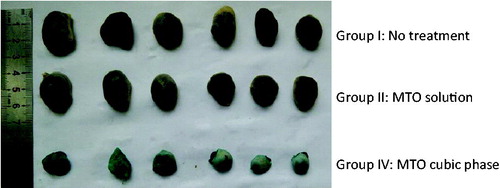
Figure 6. Immunohistochemical images (40×) of CRT expression following melanoma therapy via the MTO formulations. (A) No treatment; (B) the MTO solution and (C) the MTO cubic phase. The arrows in the images indicate the sites of CRT expression.
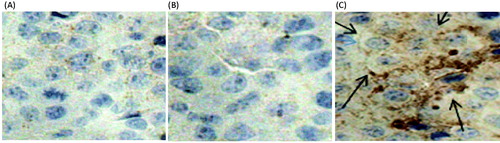
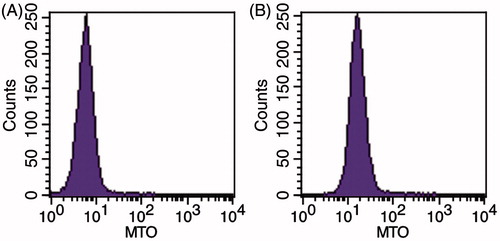
Figure 7. Flow cytometric graphs for the B16 cells exposed to the MTO formulations. (A) No treatment and (B) the MTO cubic phase.