Figures & data
Figure 1. Particle size distribution of probucol-loaded micelles.
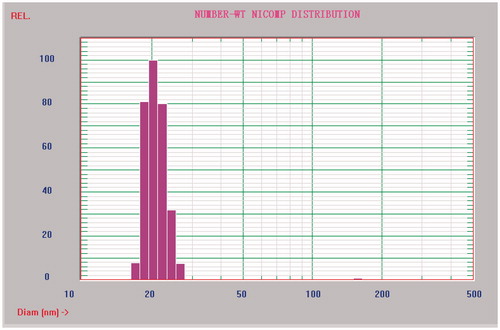
Figure 2. Effect of mPEG-DSPE micelles on uptake of probucol in the Caco-2 cell. The data represent the mean ± SD, n = 4 (*p < 0.05, versus group of drug).
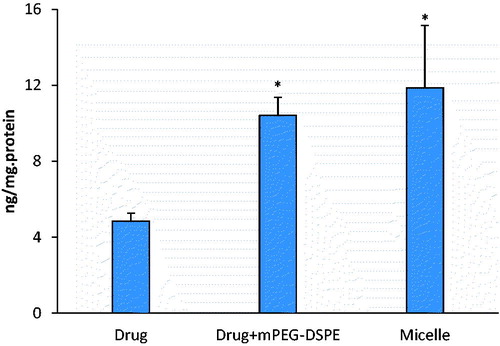
Figure 3. Effect of mPEG-DSPE micelles on transport of probucol in the Caco-2 cell. The data represent the mean ± SD, n = 4 (*p < 0.05, versus group of drug).
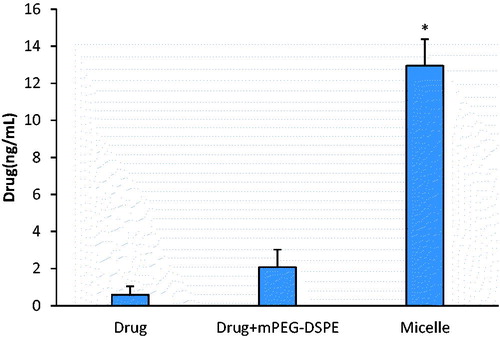
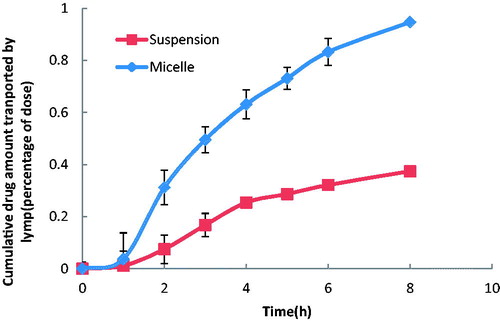
Figure 4. The mean cumulative drug amount in lymph versus time profiles of probucol in the anesthetic rat model. The data represent the mean ± SD, n = 5.
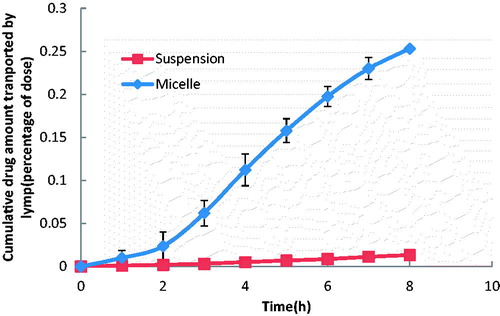
Figure 5. The mean cumulative drug amount in lymph versus time profiles of probucol in the conscious rat model. The data represent the mean ± SD, n = 5.