Figures & data
Figure 1. (A) Chemical structure of pectin showing its functional groups: (a) carboxyl; (b) amide; (c) ester groups. (B) Chemical structure of chitosan. The indices x and y represent the mole fractions of d-glucosamine and N-acetyl-d-glucosamine moieties, respectively. (C) Schematic illustration of the formation of PG-loaded microparticles. * Indicates continuation of the structure.
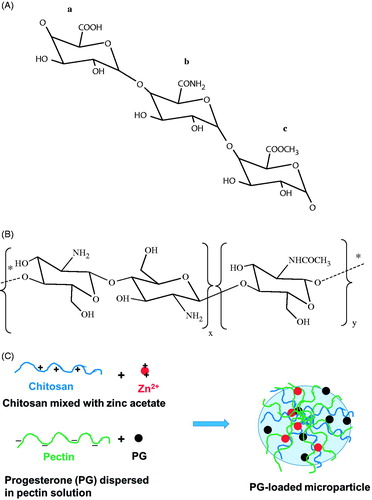
Table 1. Preparation conditions of progesterone-loaded Zn-pectinate/chitosan microparticles.
Figure 2. FT-IR spectra of (A) PG, (B) pectin, (C) chitosan, (D) empty Zn-pectinate/chitosan microparticles and (E) PG-loaded Zn-pectinate/chitosan microparticles.
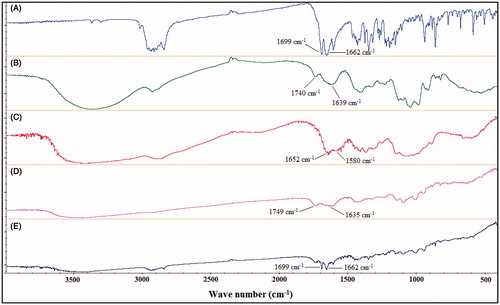
Figure 3. DSC thermograms of (A) PG, (B) pectin, (C) chitosan, (D) empty Zn-pectinate/chitosan microparticles and (E) PG-loaded Zn-pectinate/chitosan microparticles.
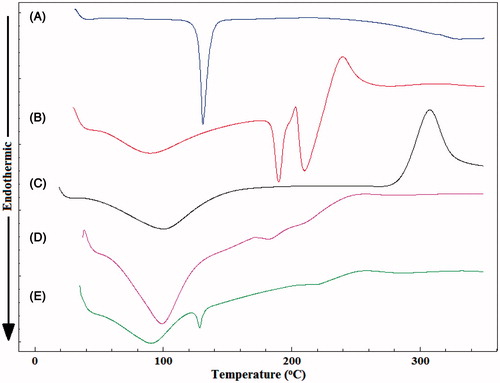
Table 2. Physical characteristics and entrapment efficiency of the prepared Zn-pectinate/chitosan microparticles.
Figure 4. (A) Effect of cross-linking pH on the mucoadhesive properties of Zn-pectinate/chitosan MPs prepared at pH 4.8 (F1) or pH 1.2 (F3) (Preparation conditions: chitosan concentration, 0.5%; pectin/PG, 4:1; cross-linking time, 120 min) (B) Effect of pectin/PG ratio on the mucoadhesive properties of pectin/chitosan MPs prepared at pectin/PG of 4:1 (F3) or 2:1 (F8) (Preparation conditions: pH, 1.2; chitosan concentration, 0.5%; cross-linking time, 120 min).
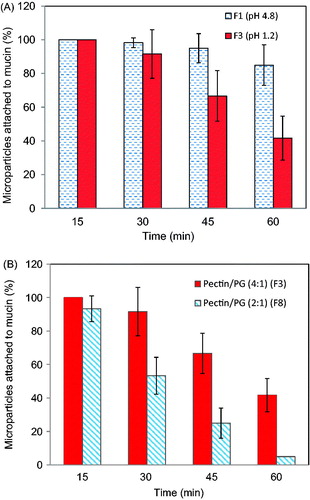
Figure 5. Swelling behavior of Zn-pectinate/chitosan MPs (F3) in enzyme-free simulated gastric fluid (SGF) and enzyme-free simulated small intestinal fluid (SSIF) as a function of time.
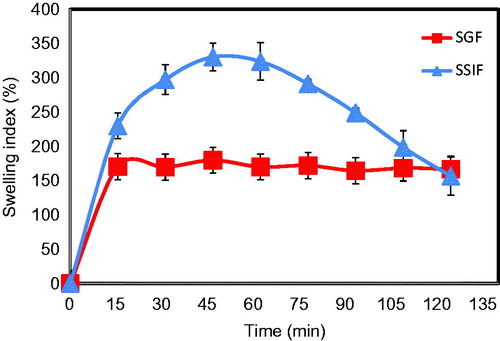
Figure 6. (A) In vitro release profiles of PG powder and PG-loaded Zn pectinate/chitosan MPs prepared at a cross-linking pH of 4.8 (Formula F1) or pH 1.2 (Formula F3). (B) In vitro release profiles of PG powder and PG-loaded Zn pectinate/chitosan MPs cross-linked for 10 min (Formula F6) or 120 min (Formula F3). (C) In vitro release profiles of PG powder and PG-loaded Zn pectinate/chitosan MPs prepared at a chitosan concentration of 0.1% w/v (Formula F4) or 0.5% w/v (Formula F3). Release medium: enzyme-free SGF (pH 1.2) for the initial 2 h, followed by enzyme-free SSIF (pH 6.8) for 0.5 h and then enzyme-free SSIF (pH 7.4) until the end of release study (30 h).
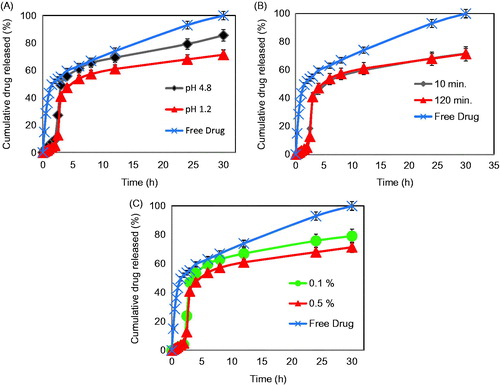
Table 3. Kinetic assessment of drug release data from different Zn-pectinate/chitosan MPs according to various kinetic models.
Figure 7. Scanning electron microscope photographs (×75 and ×1000 magnifications) of different formulations of PG-loaded Zn pectinate/chitosan MPs. (A) Formula F1, (B) Formula F3 and (C) Formula F4. Left panels are taken at magnification ×75 and right panels at ×1000.
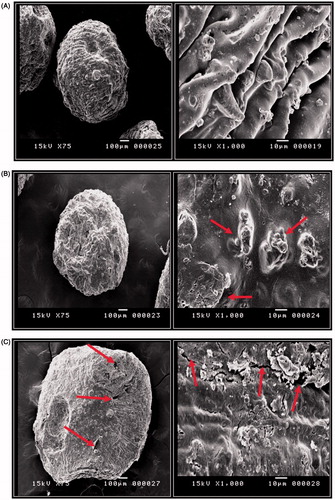
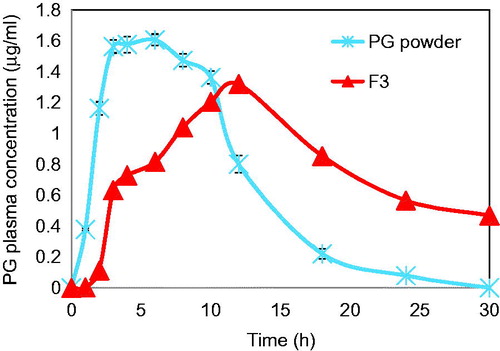
Figure 8. Mean plasma concentration-time profiles of PG after oral administration of selected Zn-pectinate/chitosan microparticle formula (F3) to healthy rabbits compared to the micronized PG powder.