Figures & data
Figure 1. Pemetrexed-loaded PEG–Peptide–PCL nanoparticles inhibited subcutaneous tumor growth. (A) Experimental design of the subcutaneous transplantation tumor model. (B) Tumor volume of established B16 xenografts in C57/B6 mice during therapy under different treatments. Empty np: empty nanoparticles; common np: pemetrexed-loaded PEG–PCL nanoparticles; targeted np: pemetrexed-loaded PEG–Peptide–PCL nanoparticles. Data were presented as mean ± SD (n = 6). *p < 0.05, **p < 0.01 versus the saline group. (C) Body weight development was monitored during treatment period. Data were displayed with SD shown (n = 6). (D) Hematoxylin and eosin (H&E) staining pictures of B16 tumors (a: Magnification 40×; b: Magnification 200×).
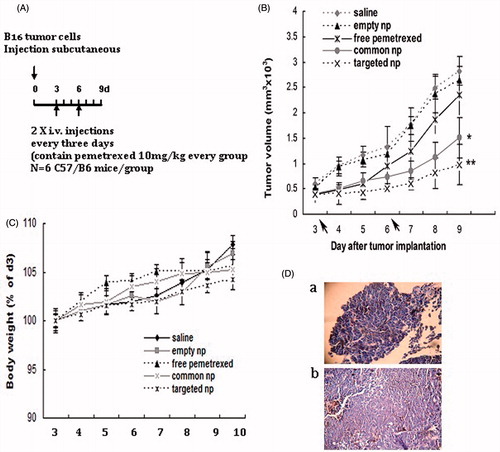
Figure 2. Pemetrexed-loaded PEG–Peptide–PCL nanoparticles inhibited pulmonary metastasis. (A) Macroscopic pictures of cancer cell affected lungs from five treatment groups (top panel) (n = 6). Tumor cells were visualized by H&E staining on paraffin-embedded tissue sections (bottom panel, black arrows indicated tumor cells; amplification: 40×). Common np: pemetrexed-loaded PEG–PCL nanoparticles; targeted np: pemetrexed-loaded PEG–Peptide–PCL nanoparticles. (B) Lung metastasis burden was calculated by counting the number of tumor nodules on the lung surface (n = 6). **p < 0.01 versus the saline group, ap < 0.05 versus the common nanoparticles group.
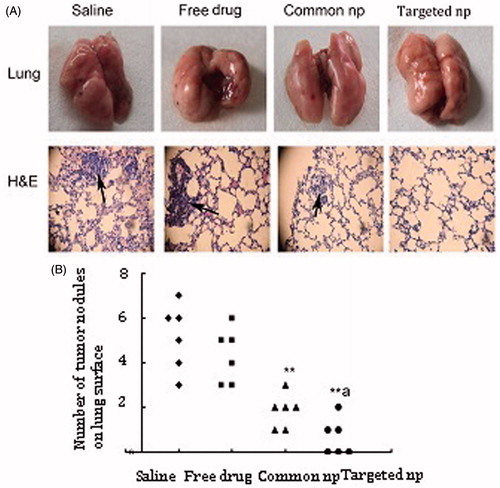
Figure 3. The E-cadherin expression of lung metastatic tissues was analyzed by immunohistochemistry and RT-PCR. (A) Immunohistochemistry panel representing the expression of E-cadherin in the normal lung tissues and lung metastatic tissues from different treatment groups (n = 6, the black arrows indicated tumor cells; amplification: 400×). Common np: pemetrexed-loaded PEG–PCL nanoparticles; targeted np: pemetrexed-loaded PEG–Peptide–PCL nanoparticles. (B) The expression levels of E-cadherin of lung metastatic tissues were analyzed by RT-PCR and normalized to GAPDH in transplanted tumor model (n = 6). All data from six samples were carried out as mean and standard deviation.
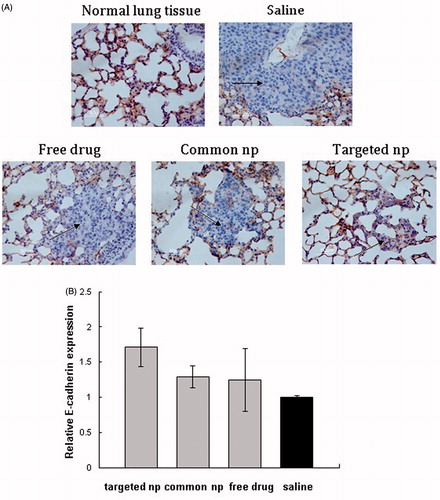
Figure 4. HE pictures and mRNA expression of E-cadherin in livers tissue samples. (A) HE pictures of livers tissue samples from corresponding treatment groups. Common np: pemetrexed-loaded PEG–PCL nanoparticles; targeted np: pemetrexed-loaded PEG–Peptide–PCL nanoparticles. (B) The expression levels of E-cadherin of liver tissues were analyzed by RT-PCR and normalized to GAPDH in transplanted tumor model (n = 6). All data from six samples were carried out as mean and standard deviation.
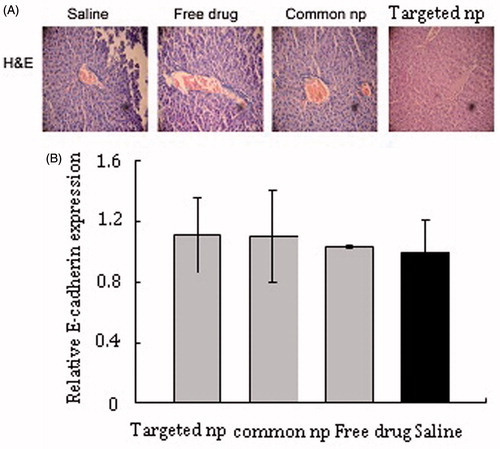
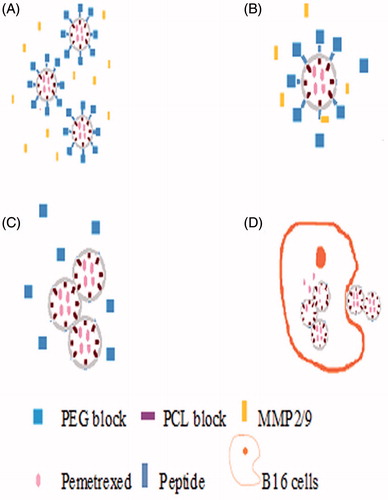
Figure 5. The release mechanism of PEG–Peptide–PCL nanoparticles. (A/B) After release from tumor capillaries, the PEG–Peptide conjugates were cleaved by gelatinases, which were specifically secreted in the tumor microenvironment. The gelatinase–stimuli strategy enhanced nanoparticles interactions with cancer cells in the tumor tissues. (C/D)The remained PCL blocks aggregated and the PEG-uncoated PCL nanoparticles interacted efficiently with cancer cells, resulting in fast drug release and effective therapeutics. PEG, poly(ethylene glycol); PCL, poly(ɛ-caprolactone).