Figures & data
Table 1. Formulation of zanamivir dry powder with different excipients.
Table 2. Variables in the central composite experimental design.
Figure 1. Moisture absorption profile for zanamivir dry powders with different excipients at 33–85% relative humidity and 30 °C.
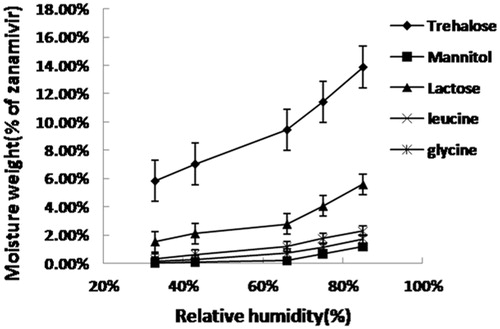
Table 3. Observed responses for the central composite rotatable design.
Table 4. Summary of results of ANOVA for measured responses.
Figure 2. Response surface plots for the mannitol (X1), l-leucine (X2) and F68 (X3) on the repose angle (Y1) – A, the GSD (Y2) – B, FPF (Y3) – C, and MMAD (Y4) – D.
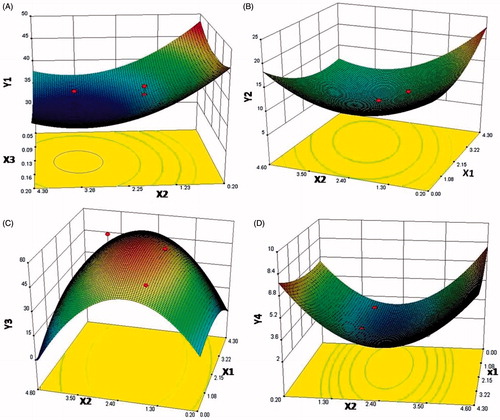
Figure 3. Scanning electron micrographs of the optimized powders.
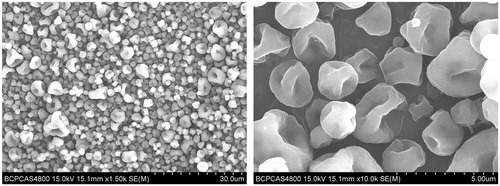
Table 5. The observed and predicted response values for the zanamivir DPIs.
Figure 4. DSC thermograms of raw zanamivir (A), physical blending powder (B), spray-dried excipients (C), dry powder formulation (D) and Relenza® (E).
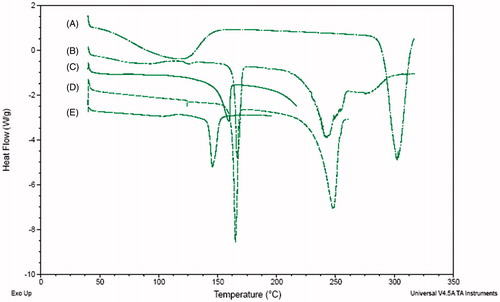
Figure 5. XPRD pattern of raw zanamivir (A), physical blending powder (B), sprayed-dried excipients (C), dry powder formulation (D) and Relenza® (E).
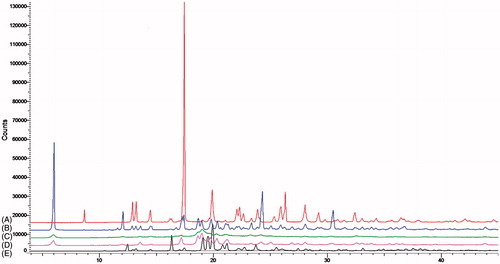
Figure 6. Moisture adsorption profile for zanamivir DPIs and Relenza® at 33–85% relative humidity and 30 °C.
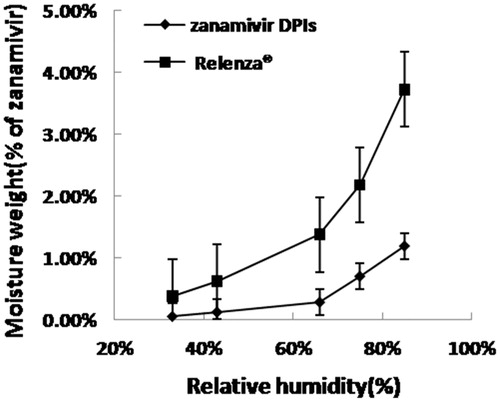
Figure 7. Mean concentration–time profile (n = 6) for zanamivir DPIs and Relenza® after endotracheal administration.
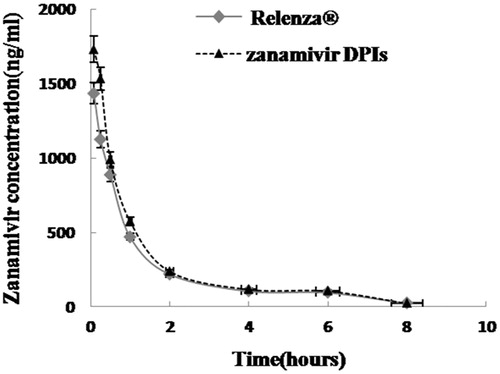
Table 6. Pulmonary pharmacokinetic parameters of zanamivir DPI and Relenza®.
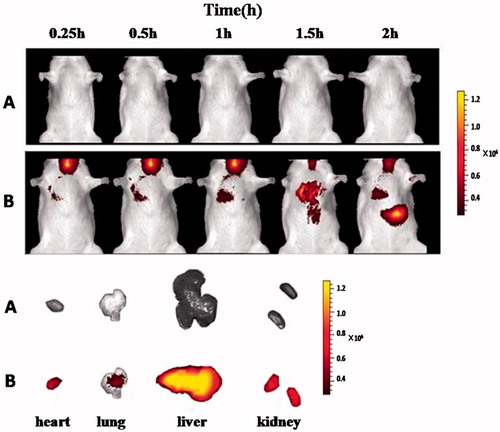
Figure 8. Live in vivo imaging of the zanamivir DPI (A), the dry powder formulation containing Cy7 (B) and organs after endotracheal administration.