Figures & data
Figure 1. TEM image of freeze-dried SLN.
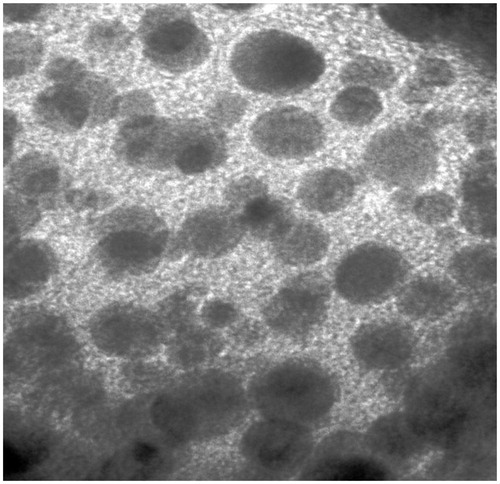
Table 1. Micromeritic properties of freeze-dried darunavir-SLN (n = 3).
Figure 2. In vitro release profile of darunavir-SLN in simulated gastric condition (n = 6, mean ± SD).
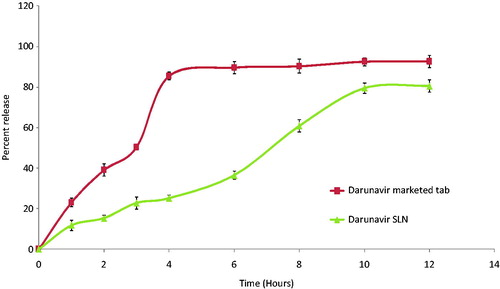
Figure 3. Ex-vivo apparent permeability of Dar SLN at (a) 37 °C, (b) 4 °C, in the presence of (c) CPZ at 37 °C and (d) NYT at 37 °C (n = 3).
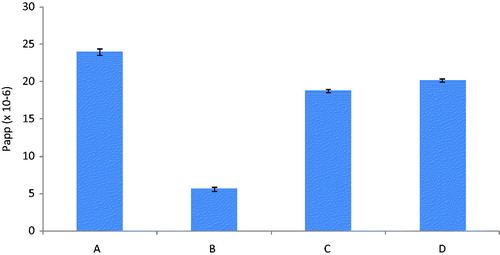
Figure 4. In-vivo plasma concentrations profile of marketed tablet and darunavir-SLN in rats (n = 6, ± SD).
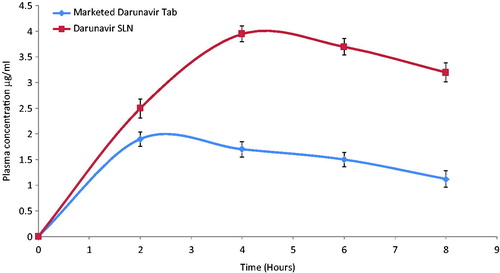
Table 2. In-vivo pharmacokinetic parameters of marketed tablet and darunavir-SLN in rats.
Figure 5. In-vivo plasma concentrations profile of darunavir-SLN in CXI-treated and CXI-non-treated rats (n = 6, ± SD).
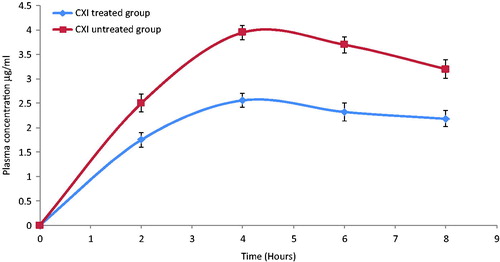
Table 3. In-vivo pharmacokinetic parameters of darunavir-SLN in rats in the presence and absence of lymphatic uptake blockers (CXI).
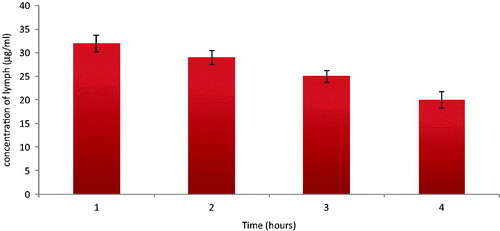
Figure 6. Concentration of darunavir in the lymphatic fluid of rats (n = 6, ± SD).