Figures & data
Table 1. Sequences of N-terminally stearylated CPPs and Sec used in this study.
Figure 1. Schematic illustration of STR-CPPs and STR-Sec co-modified nanoparticles loaded with Ins-SPC complex. SE represents the low molecular weight emulsifier.
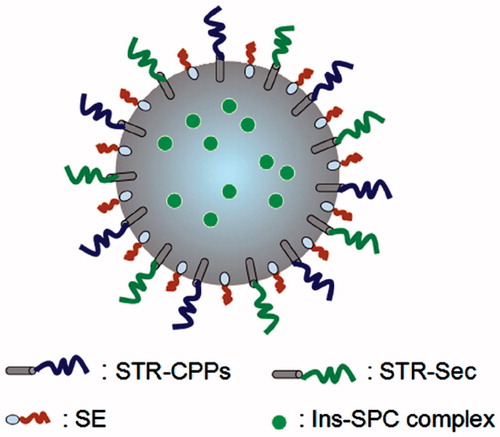
Figure 2. Transmission electron microscopy (TEM) images of Pen-NPs (A) and Sec-Pen-NPs (B). The scale bar represents 200 nm.
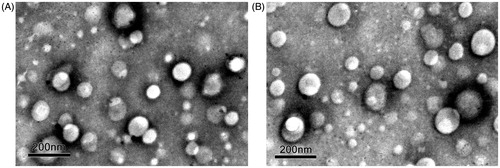
Table 2. Characteristics of coumarin-6 (C6)-loaded nanoparticles (mean ± SD, n = 3).
Table 3. Characteristics of insulin-loaded nanoparticles (mean ± SD, n = 3).
Figure 3. In vitro release of insulin from insulin-loaded nanoparticles (unmodified NPs, Pen-NPs, Sec-Pen-NPs) in simulated intestinal medium (PBS, pH 6.8) without trypsin at defined intervals. Each data point was expressed as the mean ± SD (n = 3).
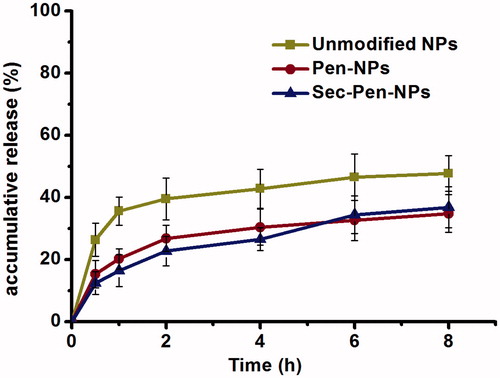
Figure 4. Remained insulin of insulin solution and insulin-loaded nanoparticles (unmodified NPs, Pen-NPs, Sec-Pen-NPs) after incubation in simulated intestinal medium (PBS, pH 6.8) with trypsin at defined intervals. Each data point was expressed as the mean ± SD (n = 3).
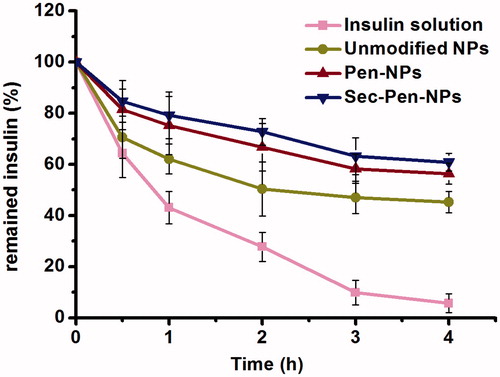
Figure 5. Transcellular transport of coumarin-6-loaded nanoparticles through Caco-2 cell monolayers at defined intervals. Each data point was expressed as the mean ± SD (n = 3).
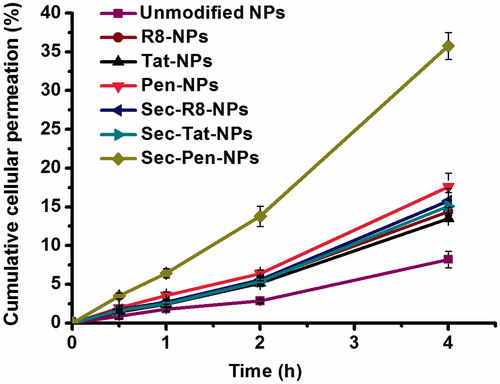
Table 4. Papp of coumarin-6-loaded nanoparticles across the Caco-2 cell monolayers (mean ± SD, n = 3).
Figure 6. Fluorescence microscopy images of Caco-2 cell monolayer incubated with coumarin-6-loaded nanoparticles: unmodified NPs (A), R8-NPs (B), Tat-NPs (C), Pen-NPs (D), Sec-R8-NPs (E), Sec-Tat-NPs (F), Sec-Pen-NPs (G) for 2 h at 37 °C.
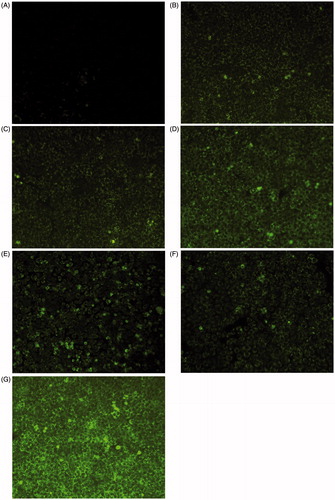
Figure 7. Cellular uptake of coumarin-6-loaded nanoparticles by Caco-2 cells at defined intervals. Each data point was expressed as the mean ± SD (n = 3).
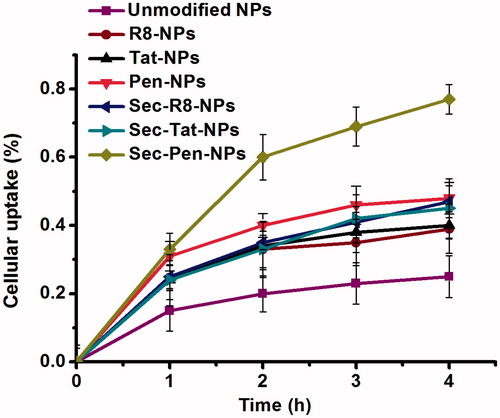
Figure 8. CCK-8 assays of cell viability after incubation of coumarin-6-loaded nanoparticles with Caco-2 cells for 2 h. Each data point was expressed as the mean ± SD (n = 3).
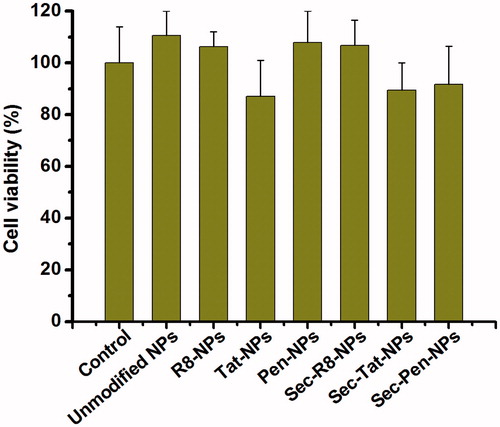
Figure 9. Plasma insulin concentration in rats after ileal segments administration of saline, insulin-loaded nanoparticles (unmodified NPs, Pen-NPs, Sec-Pen-NPs) at a dose of 10 IU/kg and s.c. administration of insulin solution (1 IU/kg). Each data point was expressed as the mean ± SD (n = 7).
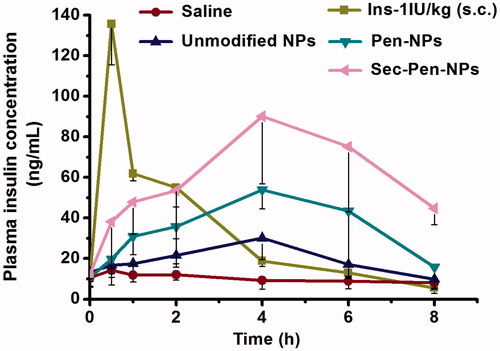
Table 5. Pharmacokinetic and pharmacodynamic parameters in rats after ileal segments administration of insulin loaded nanoparticles (Unmodified NPs, Pen-NPs, Sec-Pen-NPs) and s.c. administration of insulin solution (mean ± SD, n = 7).
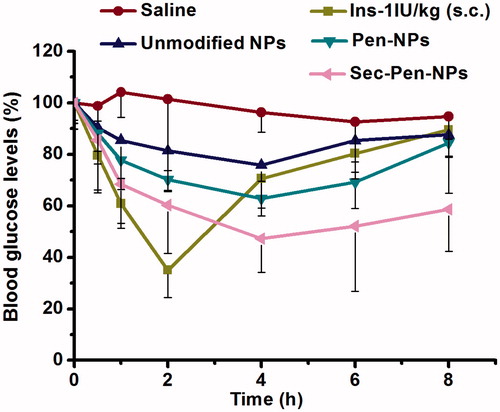
Figure 10. Blood glucose levels in rats after ileal segments administration of saline, insulin-loaded nanoparticles (unmodified NPs, Pen-NPs, Sec-Pen-NPs) and s.c. administration of insulin solution. Each data point was expressed as the mean ± SD (n = 7).