Figures & data
Figure 1. In vitro cytotoxicity of PTX-loaded micelles, Taxol formulation, Cremophor EL and blank micelles against MCF-7 cells after 24 h (A) and 48 h (B) incubation (mean ± SD, n = 3).
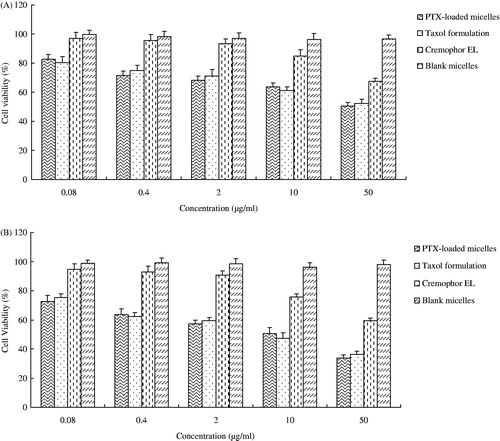
Figure 2. Fluorescence images of MCF-7 cells after incubation with FITC-labeled PTX-loaded CS-TOS micelles for (A) 2 h, (B) 4 h, (C) 8 h, (D) 24 h, and (E) FITC-labeled CS for 8 h.
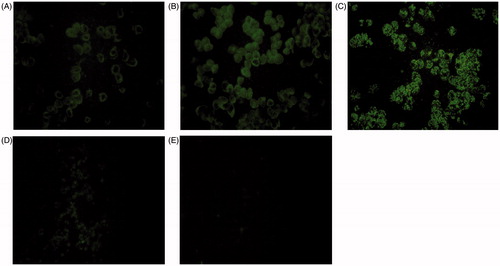
Figure 3. Plasma concentration-time curves of PTX after intravenous administration of PTX-loaded micelles and Taxol formulation to rats at the dose of 10 mg/kg (mean ± SD, n = 6). *p < 0.05, compared with Taxol formulation.
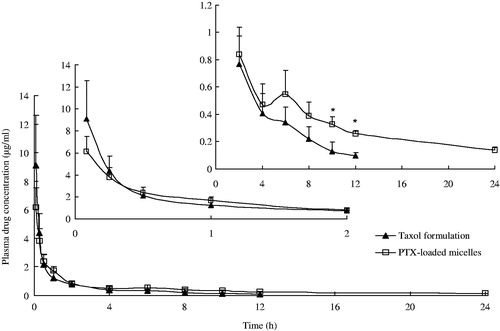
Table 1. Pharmacokinetic parameters of PTX in rats after intravenous administration of PTX-loaded micelles and Taxol formulation at the dose of 10 mg/kg (mean ± SD, n = 6).
Figure 4. Biodistribution of PTX in the heart, liver, spleen, lungs and kidneys in mice after intravenous injection of (A) PTX-loaded micelles and (B) Taxol formulation at 10 mg/kg (mean ± SD, n = 3).
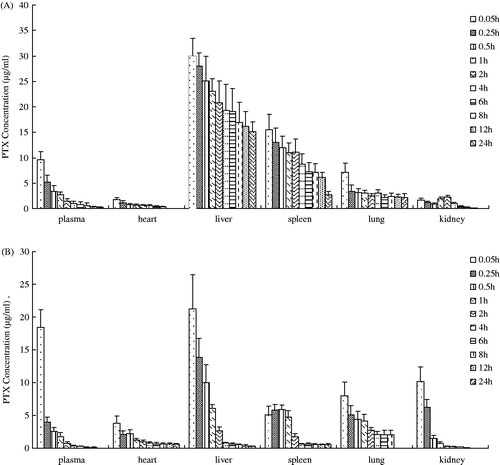
Figure 5. Photographs of tumors from each treatment group excised after IV treatment of PTX-loaded micelles and Taxol formulation on U14 tumor-bearing mice.
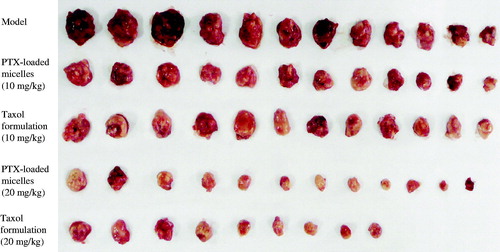
Figure 6. Body weight changes after IV treatment of PTX-loaded micelles and Taxol formulation on U14 tumor-bearing mice (mean ± SD, n = 12).
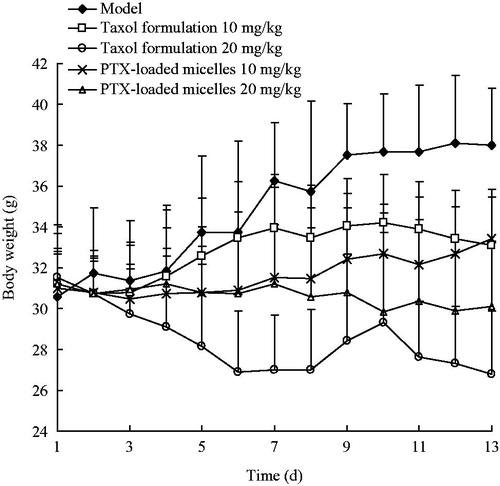
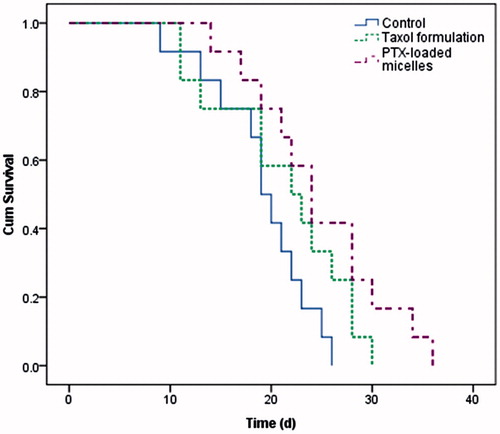
Figure 7. Kaplan–Meier survival curves of U14 tumor-bearing mice after IV treatment of PTX-loaded micelles and Taxol formulation (n = 12).