Figures & data
Figure 1. Schematic diagram of Tat-CS-NPs.
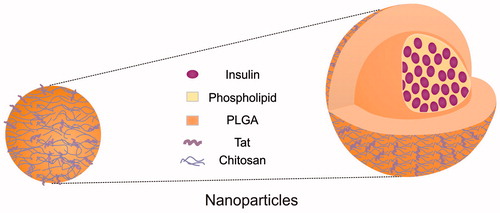
Figure 2. FT-IR spectra of chitosan and its synthetic derivative. (A) FT-IR spectrum of chitosan and (B) FT-IR spectrum of N,N,N-trimethyl-N-dodecyl chitosan.
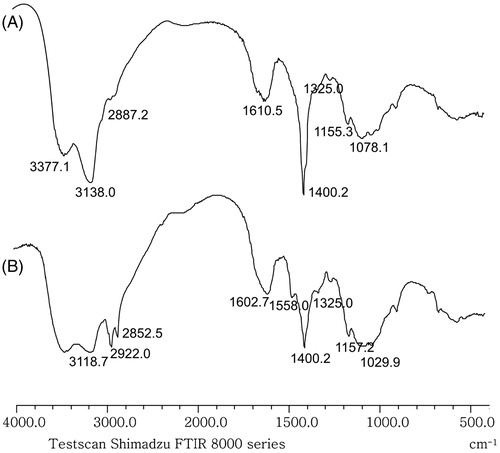
Figure 3. 1H NMR spectra of chitosan and its synthetic derivative. (A) 1H NMR spectrum of chitosan and (B) 1H NMR spectrum of N,N,N-trimethyl-N-dodecyl chitosan.
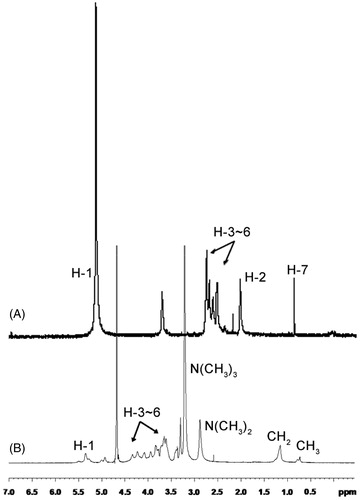
Figure 4. Typical droplet size distribution diagram of Tat-CS-NPs.
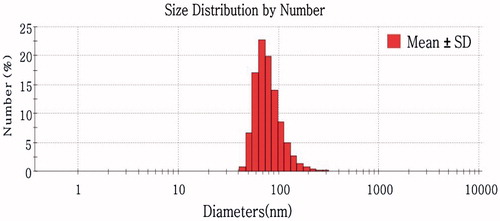
Table 1. Particle size, zeta potential, encapsulation efficiency and drug loading of PVA-NPs, CS-NPs, Tat-CS-NPs and Blank Tat-CS-NPs (Mean ± SD, n = 3).
Figure 5. Transmission electron micrograph of Tat-CS-NPs (×40 000).
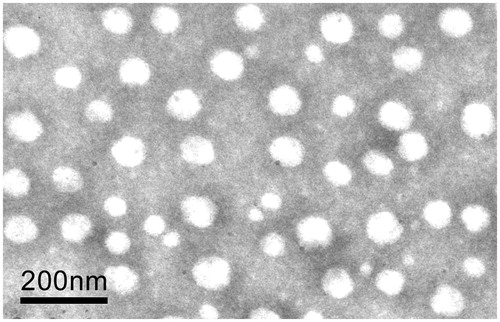
Figure 6. In vitro cumulative insulin release profiles of PVA-NPs, CS-NPs and Tat-CS-NPs in simulated gastric fluid (pH 1.2 hydrochloric acid solution) (A) and in simulated intestinal fluid (pH 7.4 PBS) (B), n = 3.
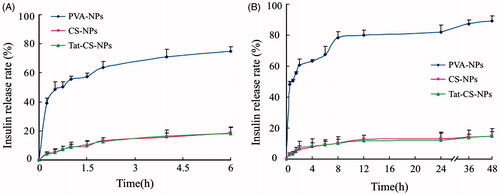
Figure 7. In vitro cytotoxicity of Tat-CS-NPs, CS-NPs, PVA-NPs and Blank Tat-CS-NPs at nanoparticle concentrations ranging from 0.1 to 10 mg/ml, n = 3, *p < 0.05.
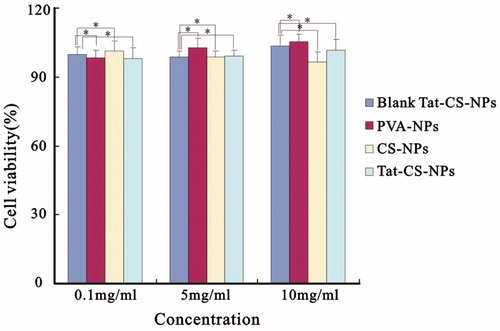
Figure 8. Fluorescence micrographs. Cellular uptake of coumarin-6-loaded PVA-NPs (A and D), coumarin-6-loaded CS-NPs (B and E) and coumarin-6-loaded Tat-CS-NPs (C and F) were observed under inverted fluorescence microscope after incubation with Caco-2 cell monolayers at 37 °C for 1 and 2 h, respectively. For PVA-NPs, green fluorescence at 2 h incubation time (D) resembles that at 1 h incubation time (A) under fluorescence microscope by visual observation; for CS-NPs, fluorescence at 2 h incubation time (E) is a bit stronger than that at 1 h incubation time (B); for Tat-CS-NPs, green fluorescence at 2 h incubation time (F) is markedly stronger than that at 1 h incubation time (C).
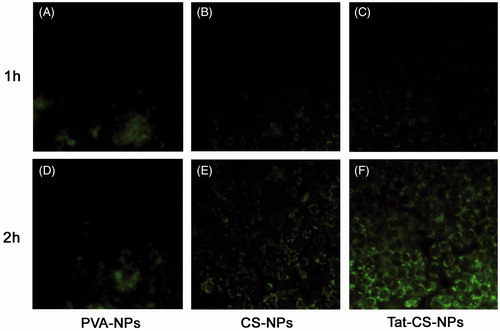
Figure 9. Uptake amount of coumarin-6. Uptake of coumarin-6-loaded NPs (PVA-NPs, CS-NPs and Tat-CS-NPs) by Caco-2 cells was evaluated at different incubation time (mean ± SD, n = 3) (*p < 0.05, #p < 0.01).
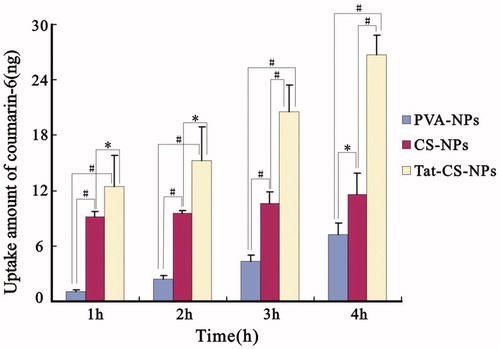
Figure 10. Cumulative amount of transported coumarin-6. Transportation performance of coumarin-6-loaded NPs (PVA-NPs, CS-NPs and Tat-CS-NPs) across the Caco-2 cell monolayer were evaluated at different incubation time (mean ± SD, n = 3) (*p < 0.05, #p < 0.01).
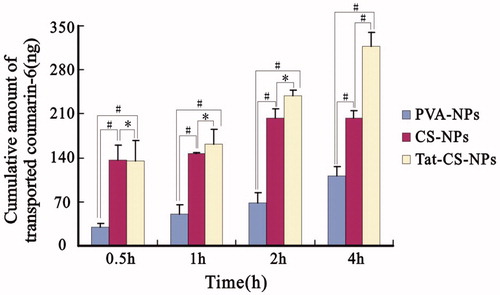
Figure 11. Blood glucose levels of diabetic rats. Blood glucose levels of diabetic rats were measured at particular intervals following subcutaneous injection (s.c.) of insulin solution at the dose of 1 IU/kg, colon delivery of physiological saline, and colon delivery of insulin solution, PVA-NPs, CS-NPs and Tat-CS-NPs at the dose of 20 IU/kg, each data point represents the mean ± SD (n = 3) (*p < 0.05, #p < 0.01).
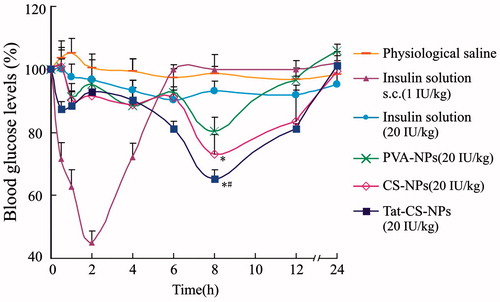
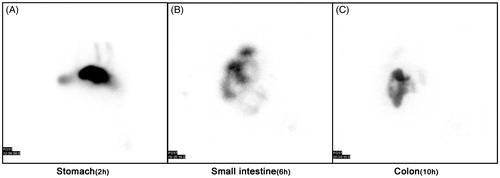
Figure 12. Scintigraphic imaging. SPECT scan on mini-pigs' stomach, small intestine and colon at 2 h (A), 6 h (B) and 10 h (C), respectively, after oral delivery of 99mTc-labeled Tat-CS-NPs (n = 3).