Figures & data
Figure 1. SEM photographs of docetaxel (DTX)/PDLLA nanofibers containing (A) 0 wt%, (B) 5 wt% DTX/PDLLA, (C) 10 wt% DTX/PDLLA and (D) 20 wt% DTX/PDLLA (100 × and 5000×).
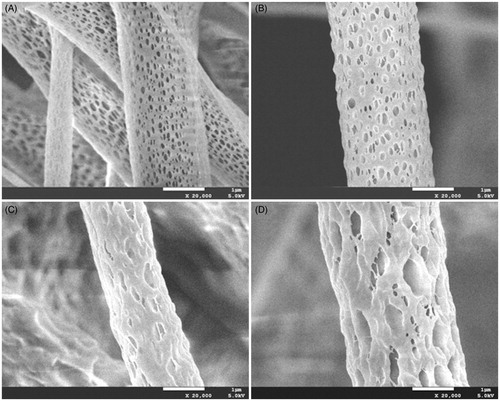
Figure 2. WAXD patterns of (A) docetaxel (DTX), (B) blank PDLLA nanofibers, (C) 5 wt%. DTX/PDLLA, (D) 10 wt% DTX/PDLLA and (E) 20 wt% DTX/PDLLA nanofibers.
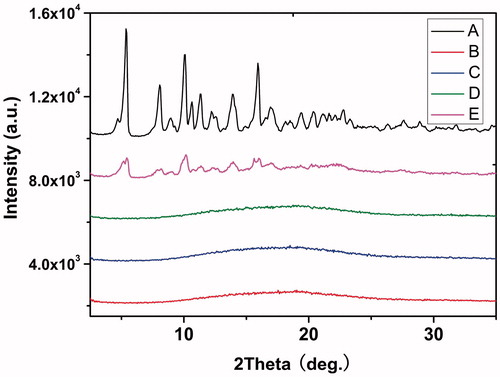
Figure 3. Release profiles of docetaxel (DTX) from the DTX/PDLLA electrospun fibers.
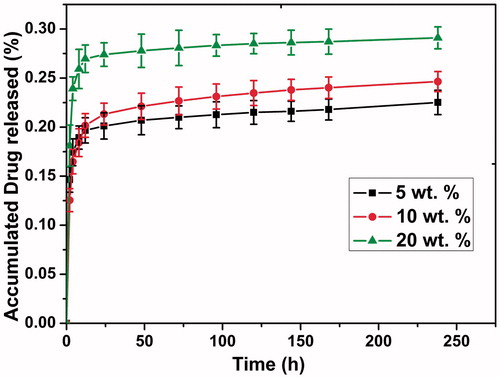
Figure 4. In vitro cytotoxicity of the blank PDLLA and docetaxel (DTX)/PDLLA fibers to the 4T1 breast cancer cells after 24, 36, 48, 60 and 72 h of drug exposure.
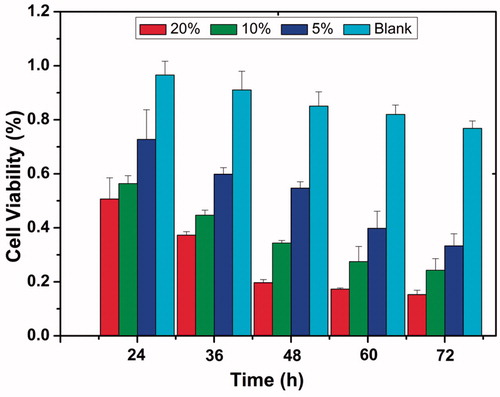
Figure 5. Docetaxel (DTX) induced cell apoptosis on 4T1 breast cancer cells. Cells were treated with (A) blank control, (B) 5 wt% DTX/PDLLA, (C) 10 wt% DTX/PDLLA and (D) 20 wt% DTX/PDLLA, and stained with DAPI (blue). Apoptosis efficiency was evaluated. (E) Blank control without treatment, (F) 5 wt% DTX/PDLLA, (G) 10 wt% DTX/PDLLA and (H) 20 wt% DTX/PDLLA. Cells were stained with Annexin-V-FITC and propidium iodide (PI). Flow cytometry profile represented by Annexin-V-FITC staining on the X axis and PI on the Y axis.
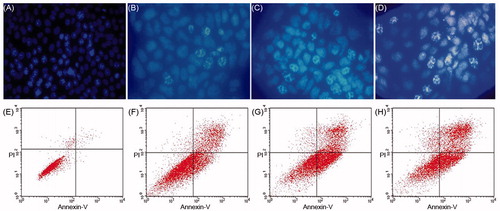
Figure 6. The concentration measured via HPLC within plasma or tissues near the surgical site following implantation of DTX/PLA nanofibers or intravenous injection of an equivalent docetaxel dose. (A) DTX/PLA nanofibers result in higher docetaxel concentration in local tissue and (B) small quantities of DTX were detected in plasma.
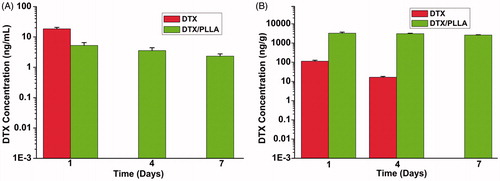
Figure 7. Implantation of docetaxel (DTX)-loaded nanofibers prevents local recurrence. (A) Locally administrated DTX/PLA obviously reduced locoregional recurrence after resection of primary tumor (p < 0.05). (B) Overall survival was improved in the DTX/PDLLA group compared with all the other groups (p < 0.05).
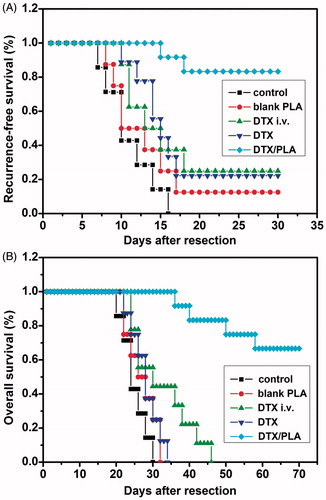
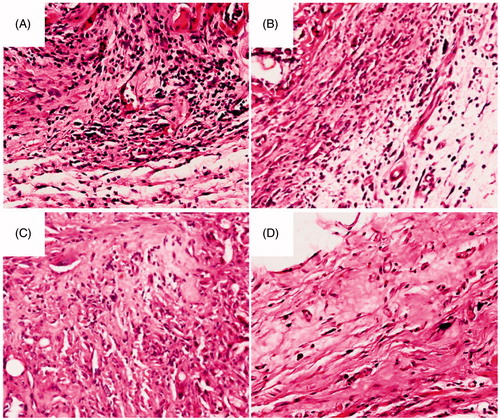
Figure 8. Histological analysis of tissue response to the DTX/PDLLA nanofibers after (A) 2 weeks, (B) 4 weeks, (C) 6 weeks and (D) 8 weeks. There was a dense accumulation of inflammatory cells presented around the DTX/PDLLA fibrous scaffolds at week 2, which degraded over time and disappeared at week 8.