Figures & data
Table 1. The size and Z-potential of DTX-NPs with different ratios of DTX/HSA.
Figure 1. Characterization of DTX-NPs. (a) Size distribution of DTX-NPs detected by DLS. (b) Zeta-potential of DTX-NPs. (c) Transmission electron microscopy (TEM) of DTX-NPs. Scale bar: 500 nm. (d) Scanning electron microscopy (SEM) of DTX-NPs. Scale bar: 500 nm.
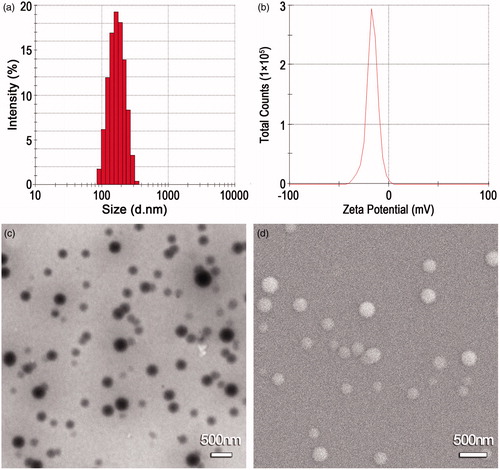
Figure 2. Measurement of encapsulation efficiency of DTX-NPs. From fraction 1 to 30, the column is eluted by water. A peak (milky solution, inset graph) was observed in the first 30 fractions indicating DTX-NPs were eluted. From fraction 31 to 65, the column was eluted by ethanol. A small peak (clear solution, inset graph) is observed indicating free DTX is eluted.
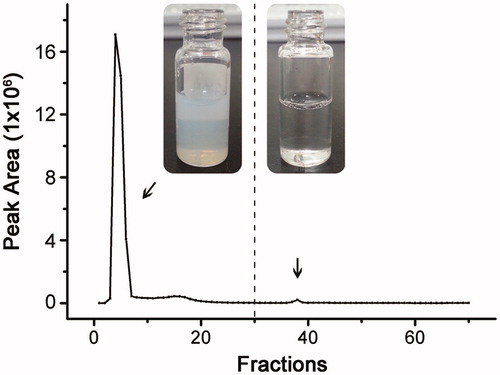
Figure 3. Status of DTX and HSA in DTX-NPs. (a) XRD patterns of DTX-NPs. (I) DTX; (II) HSA; (III) Physical mixture of DTX and HSA (9:100 DTX:HSA, w/w), the arrows point out typical diffraction peaks of DTX in the mixture; (IV) DTX-NPs (9:100 DTX:HSA, w/w). (b) Percentages of various secondary structures of natural HSA and HSA in DTX-NPs. Each data point is represented as mean ± SD (n = 3).
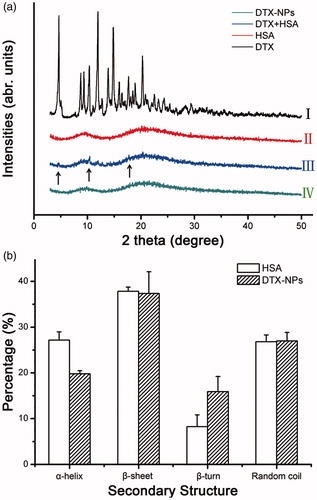
Figure 4. (a) In vitro stability of DTX-NPs in 0.9% NaCl and 5% glucose at 25 °C. (b) In vitro release profile of DTX-NPs in 0.2 M Phosphate buffer, pH 7.4, containing 2% β-cyclodextrin (m/v). Each data point is represented as mean ± SD (n = 3).
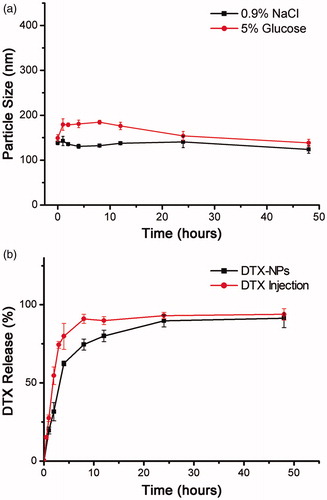
Figure 5. In vitro cytotoxicity of DTX-NPs. (a) Cell viability of MCF-7 against DTX injection and DTX-NPs for 48 h co-incubation; (b) Cell viability of CT26 against DTX injection and DTX-NPs for 48 h co-incubation. Each data point is represented as mean ± SD (n = 6).
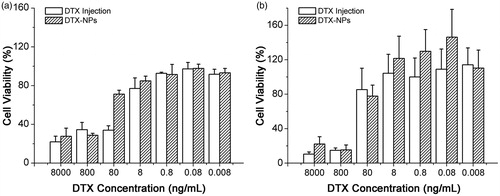
Figure 6. In vitro hemolysis of DTX-NPs. (a) The hemolysis percentage of DTX-NPs and DTX injection. Each data point is represented as mean ± SD (n = 3). (b) The hemolysis photograph of DTX-NPs and DTX injection.
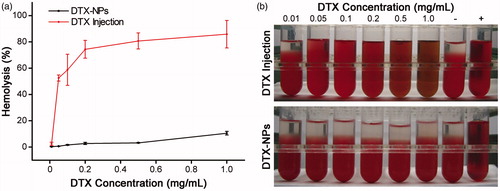
Figure 7. In vivo tolerances of DTX-NPs. Survival of mice after injection of series cumulative doses of DTX-NPs and DTX injection.
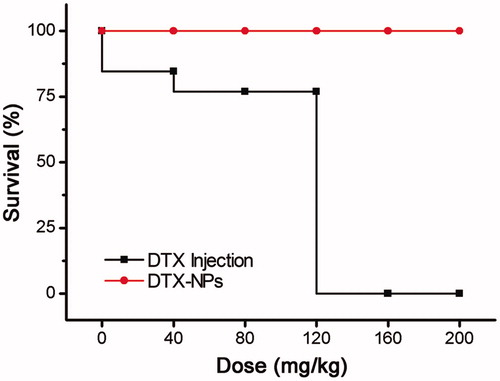
Figure 8. In vivo biodistribution of DTX-NPs. (a) In vivo NIRF imaging after mice receiving NIR-775-DTX-NPs and free NIR-775. (b) The quantitation of NIRF imaging in tumor. (c) In vivo tissue distribution at 24 h after injection of DTX-NPs and DTX injection. Each data point is represented as mean ± SD (n = 3) (**p < 0.01).
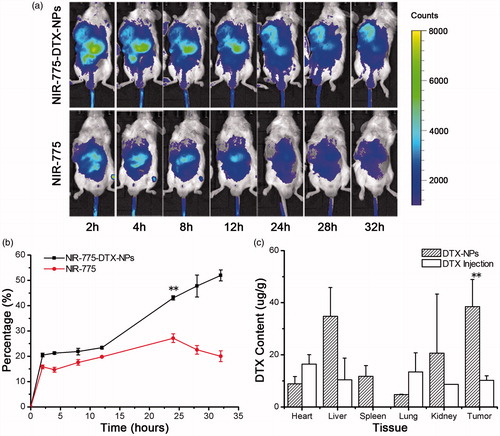
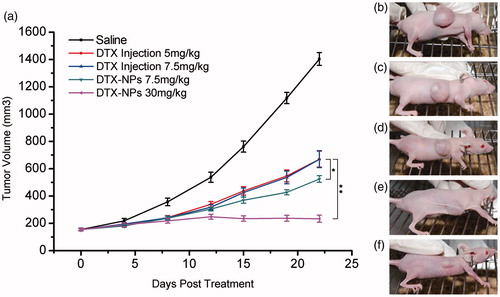
Figure 9. In vivo antitumor efficacy of DTX-NPs. (a) Tumor volumes of tumor xenograft mice after injection of saline, DTX injection and DTX-NPs. Each data point is represented as mean ± SD (n = 7) (*p < 0.05; **p < 0.01). (b–f) Photograph of tumor xenograft mice on Day 22 after injection of saline, 5 mg/kg DTX injection, 7.5 mg/kg DTX injection, 7.5 mg/kg DTX-NPs and 30 mg/kg DTX-NPs, respectively.