Figures & data
Table 1. Independent and dependent variables of the D-optimal mixture design.
Table 2. The formulations of the mixture design and their characterization results.
Table 3. Regression results of the measured responses.
Table 4. The selected equations describing each response of floating CNZ emulsion gel calcium pectinate beads.
Figure 1. In-vitro release profile of CNZ from emulsion gel calcium pectinate beads formulae in 0.1 N HCL.
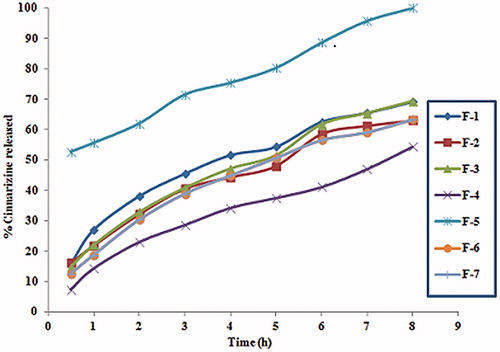
Figure 2. The 3D surface plot of floating CNZ calcium pectinate bead formulations at different time intervals.
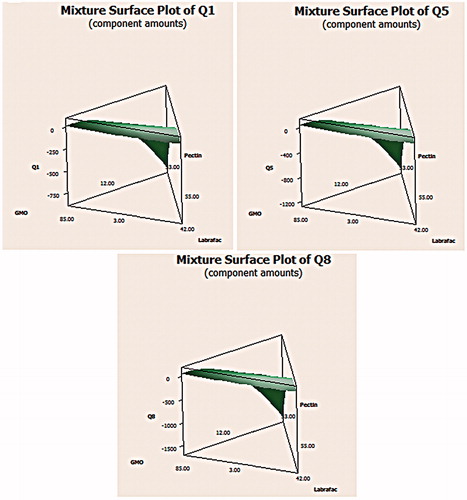
Figure 3. The 2D contour plot describing the percent of drug entrapped.
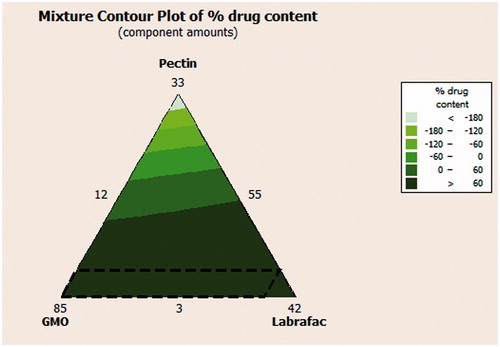
Table 5. The observed and predicted values for the optimized formulation.
Figure 4. Release of CNZ from the optimized floating emulsion gel calcium pectinate beads formulation.
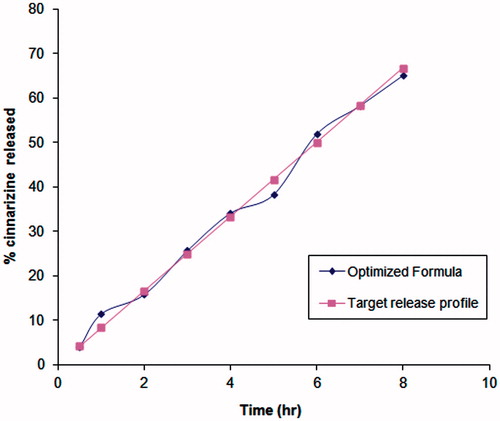
Figure 5. 3D surface plot showing swelling index of CNZ-loaded calcium pectinate beads.
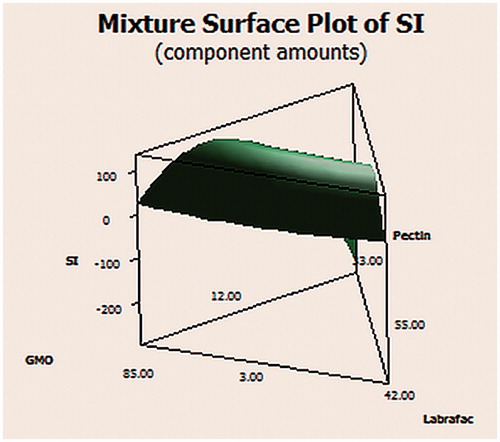
Table 6. Floating CNZ emulsion gel calcium pectinate beads in the mixture design and optimized formula with their % SI.
Figure 6. A light photo for the optimized CNZ-loaded calcium pectinate beads.
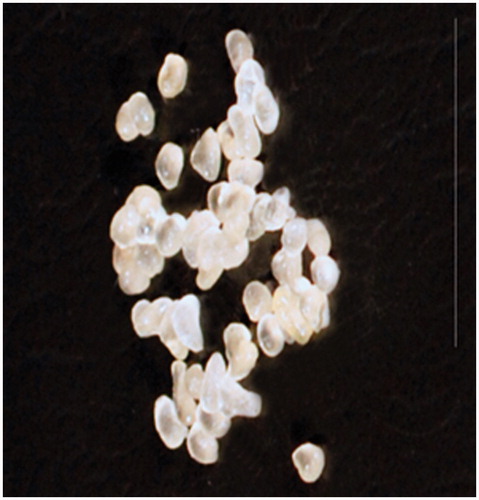
Figure 7. SEM micrographs of CNZ-loaded calcium pectinate beads at different magnification powers. (a,b) Before release in 0.1 N HCl. (c,d) after 8 h release in 0.1 N HCl.
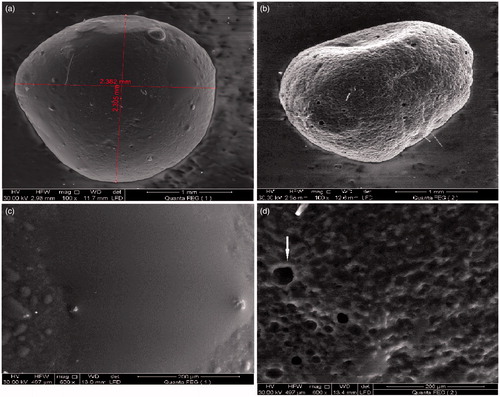
Figure 8. CNZ-loaded calcium pectinate beads in 0.1 N HCL at zero time, after 4 and 8 h.
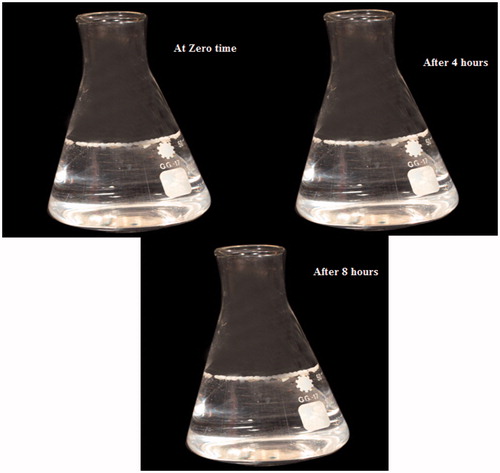
Figure 9. LC-MS/MS chromatograms of blank human plasma.
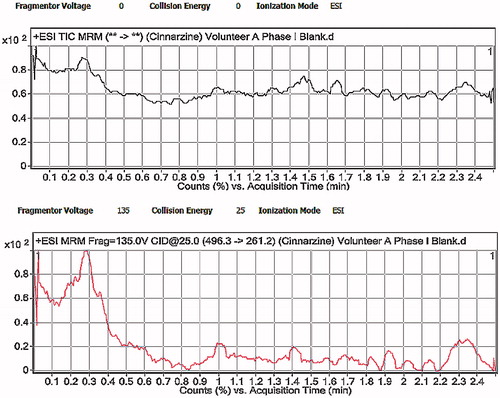
Figure 10. LC-MS/MS chromatograms of human plasma after oral administration of CNZ optimized formula.
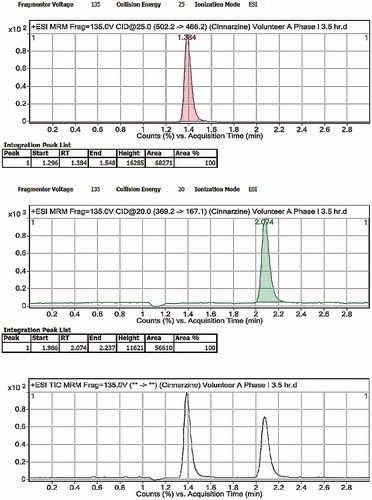
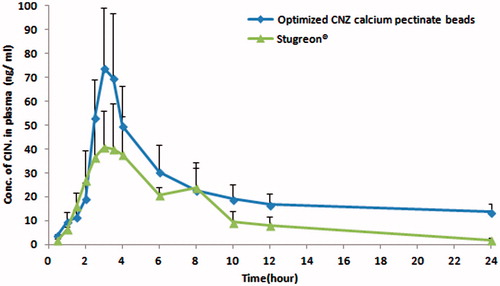
Figure 11. Plasma concentration–time curve of Stugeron® tablets and optimized CNZ emulsion-loaded calcium pectinate beads.