Figures & data
Figure 1. Chemical structure of the synthesized PBAE. The presence of two methylene units in the backbone increases the hydrophobicity of the region next to the ester bond and decreases water attack on the bond, decreasing the degradation rate of the polymer.
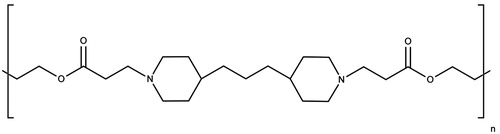
Figure 2. Schematic illustration of beads loaded with Lys and coated with alternating layers of CS and PBAE.
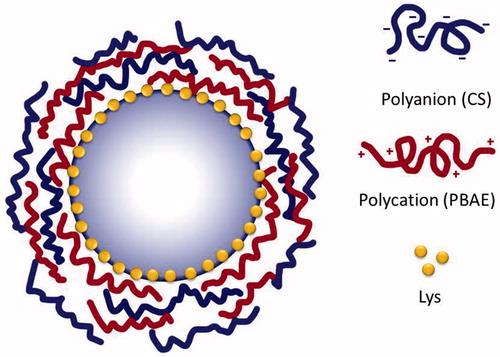
Figure 3. Beads loaded with Lys-Rhd: fluorescent image and fluorescence intensity profile along the line indicated on the image.
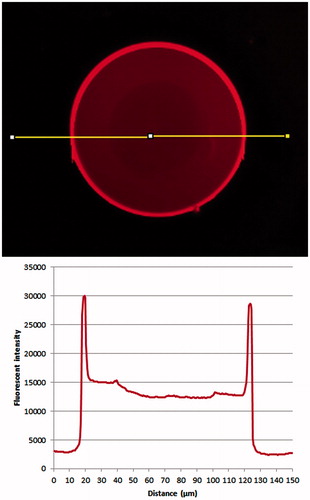
Figure 4. Reversal of zeta potential of beads with addition of successive polyelectrolyte layers (n = 6, error bars represent SDs).
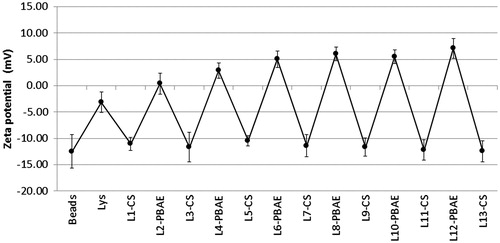
Figure 5. Optical microscopy images of beads (a) with negative outer surface, (b) with positive outer surface (each major mark indicates a distance of 50 µm).
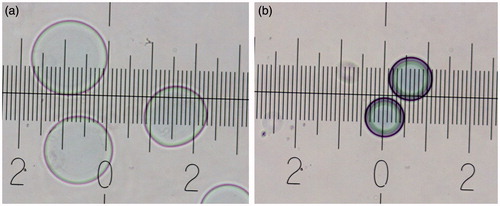
Figure 6. SEM images showing (a) beads before coating and (b) after coating with 13 layers (F13). Scale bar = 10 µm.
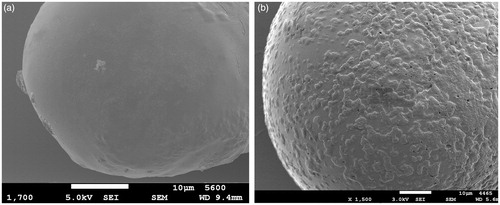
Figure 7. Loss of Lys after LbL coating (n = 3, error bars represent SDs, *indicates significant difference, p < 0.05).
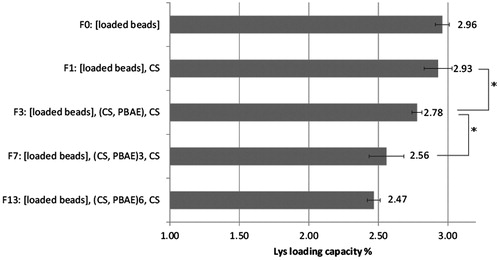
Figure 8. In vitro release studies of different formulations (n = 3, error bars represent SDs).
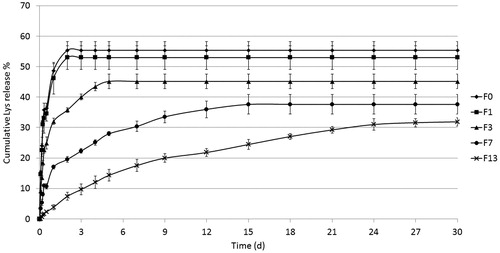
Table 1. Different release parameters of investigated formulations.
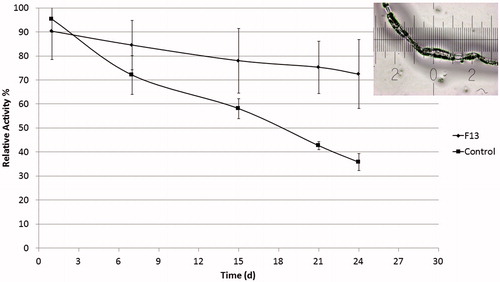
Figure 9. Activity of Lys released from slow release formulation (F13) compared to activity of Lys in PBS (control) subjected to the same condition and expressed as relative activity % in comparison to freshly dissolved Lys in PBS. Corner image shows Lys fibril aggregations in control solution after 24 days (n = 3, error bars represent SDs).