Figures & data
Table 1. Treatment schedules of repaglinide formulations for antidiabetic activity in SD rats.
Figure 1. Bar diagram showing the highest solubility of repaglinide in sefsol 218. HCO, hydrogenated castor oil; CP90, Caproyl 90; SF218, Sefsol 218; T80, Tween-80; T20, Tween-20, TCN, triacetin; LBF, labrafac; LRG, lauroglycol; IPM, isopropyl myristate; OA, oleic acid; S:T 80 (2:1), Sefsol:Tween-80 (2:1); S:T 80 (1:1), Sefsol:Tween-80 (1:1).
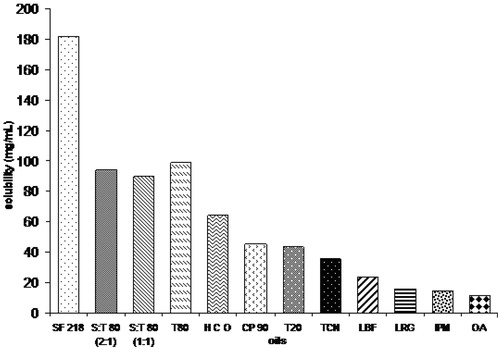
Figure 2. Pseudo-ternary phase diagrams [Smix ratio = 1:0 (A), 1:1 (B), 2:1 (C),3:1 (D), 1:2 (E) and 1:3 (F)]. The dotted area represents o/w nanoemulsion region.
![Figure 2. Pseudo-ternary phase diagrams [Smix ratio = 1:0 (A), 1:1 (B), 2:1 (C),3:1 (D), 1:2 (E) and 1:3 (F)]. The dotted area represents o/w nanoemulsion region.](/cms/asset/07d985b2-ea93-43a9-bc34-7176fd03d621/idrd_a_1077290_f0002_b.jpg)
Table 2. Observations for thermodynamic stability study and dispersibility test of repaglinide nanoemulsion formulations.
Figure 3. (A) Transmission electron microscopic positive image of optimized repaglinide nanoemulsion (Formulation RN13). (B) Size distribution by intensity of optimized nanoemulsion (Formulation RN13).
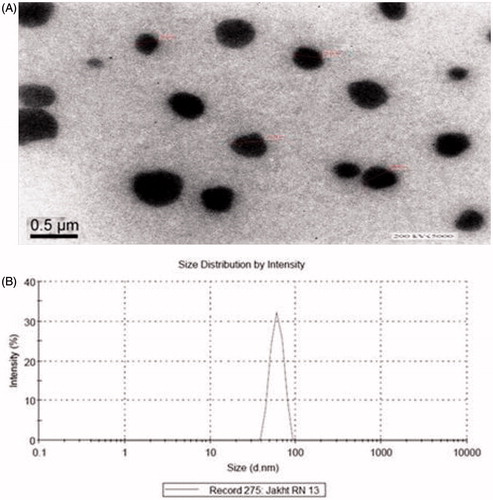
Table 3. Droplet size, polydispersity index, viscosity, refractive index and electrical conductivity of selected repaglinide nanoemulsion formulations.
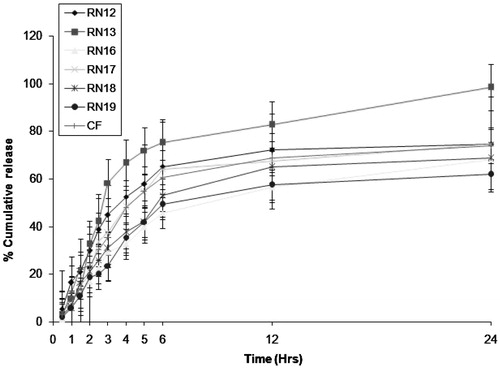
Figure 4. Comparative in vitro release profile of different formulations of repaglinide. All the values were expressed in mean ± SD (n = 3).