Figures & data
Figure 1. In vitro growth inhibitory activity of NK012 in human, rat and mouse glioma cells. U87MG, 9L, F98 and GL261 cells were placed in 96-well plates and treated for 72 h with various NK012 (0–6 µM) concentrations. After incubation for 72 h, 10% of CCK-8 regent was added to each well followed by incubation for 1 h at 37 °C, and then absorbance at 450 nm was measured in a 96-well spectrophotometric plate reader. Cell viability was measured in triplicate and was repeated three times. Data were averaged and normalized against the non-treated controls to generate dose–response curves.
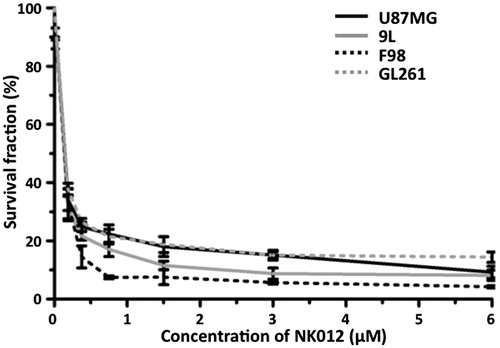
Figure 2. Evaluation of distribution of NK012 in normal rats. (A and B) Distributions of free SN-38 (A) and NK012 (B) (0.2 mg/ml; 20 μl) infused by CED into the striatum of rat brains. Animals were euthanized immediately after infusion and serial sections were obtained using a cryostat (20 μm thickness; 1 mm interval). Bright-field images reveal the brain tissue (upper row), and the same sections visualized with a fluorescence microscope detect the fluorescence generated from SN-38 under ultraviolet radiation (lower row). Serial images obtained from representative rats are shown. (C) Mean volumes of distribution after infusion of NK012 and free SN-38. Columns show mean of determinations; bars, SD. ***p < 0.001.
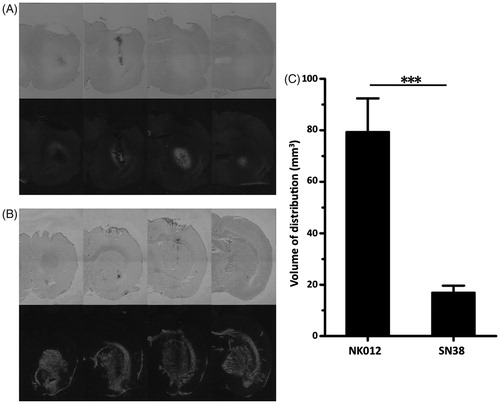
Figure 3. Representative histological changes in brain tissues after CED of NK012 (2.0 mg/ml, 0.04 mg) infused locally into the intact striatum. Animals were euthanized 14 days after CED and brain sections (4 μm) were obtained for hematoxylin and eosin staining. Rats survived without neurological symptoms and negligible tissue damage.
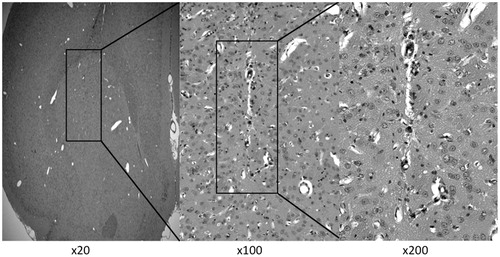
Figure 4. Effect of CED of NK012 on the rodent orthotopic brain tumor models. (A) Outcome for rats bearing 9L tumors with single CED infusions of 5% glucose, free SN-38 and NK012. Five days after tumor implantation within the brain, rats were treated with 2 mg/ml of each agent. Median survivals for these groups were 29, 28 and 42 days, respectively. Statistically significant differences were observed between the control and NK012 groups (p = 0.0063, log-rank test) and between the free SN-38 and NK012 groups (p = 0.0045, log-rank test). (B) Animals implanted with U87MG tumor cells received NK012 on day 5 after tumor implantation. Median survivals for this group were 21 days for the control group and 28 days for the NK012 group. CED treatment with NK012 resulted in a significant survival benefit compared to the control (p = 0.0003, log-rank test).
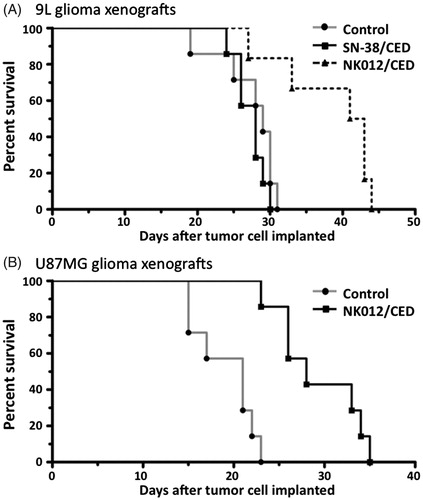
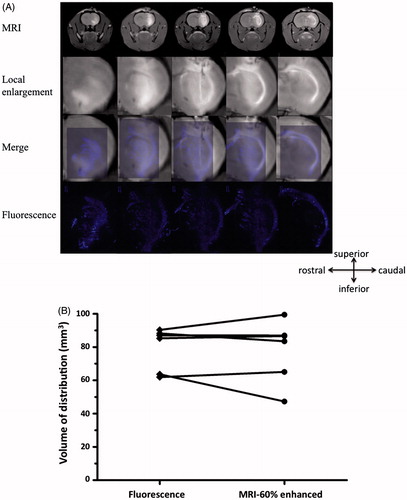
Figure 5. (A) Superimposed fluorescence and MR images of Gd co-delivered to the rat brain using CED. Correlation of MR images and histological fluorescence images showed the accuracy of the MRI monitoring method. Animals euthanized immediately after real-time MRI were processed for histological detection of fluorescence generated from NK012 that was co-infused with Gd. The fluorescence areas overlapped with the Gd distribution detected by MRI. (B) Volume calculations done with MRI data and histological fluorescence data further confirmed this finding.