Figures & data
Figure 1. Solubility of MB in various oils. Data expressed as mean ± SD (n = 3).
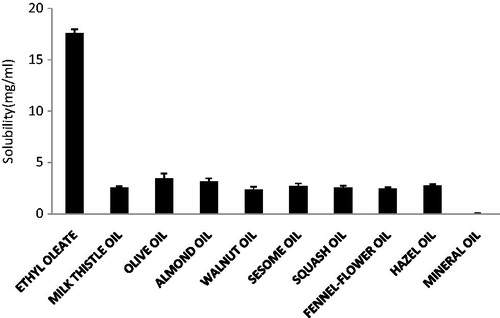
Figure 2. Solubility of mebudipine in various solvent. Data expressed as mean ± SD (n = 3).
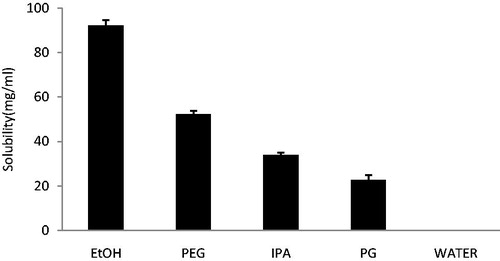
Table 1. Mean (±S.D.) percentage transmittance of formulation with different Smix at 650 nm, 25 °C (n = 3).
Figure 3. Pseudo-ternary diagram of system with different ratio of surfactant (T80 + S80) to co-surfactant (PEG + Etoh) indicating O/W nanoemulsion region at different Smix ratios. (A) Smix ratio = 1:0; (B) Smix ratio = 1:1; (C) Smix ratio = 1:2; (D) Smix ratio = 1:3; (E) Smix ratio = 2:1.
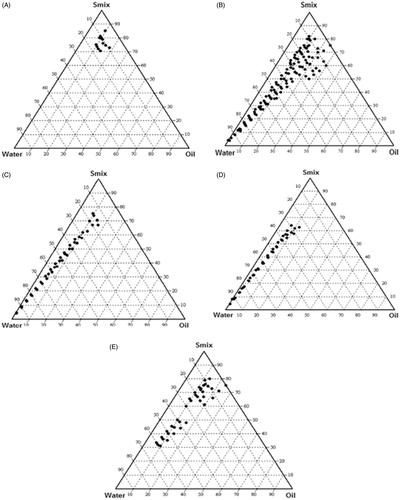
Figure 4. Pseudo-ternary diagram indicating O/W nanoemulsion region at different co- surfactant ratio. (A) PEG/Etoh = 1/1; (B) PEG/Etoh = 2/1; (C) PEG/Etoh = 1/2; (D) PEG/Etoh = 3/1.
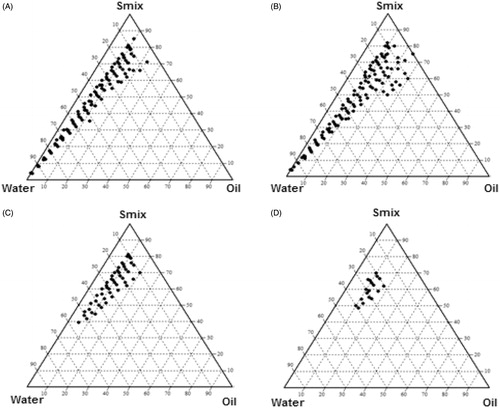
Table 2. Thermodynamic stability test of different formulations selected from phase diagram.
Table 3. Composition, droplet size and polydispersity index of selected nanoemulsion formulations.
Figure 5. Transmission electron micrograph of MB nanoemulsion.
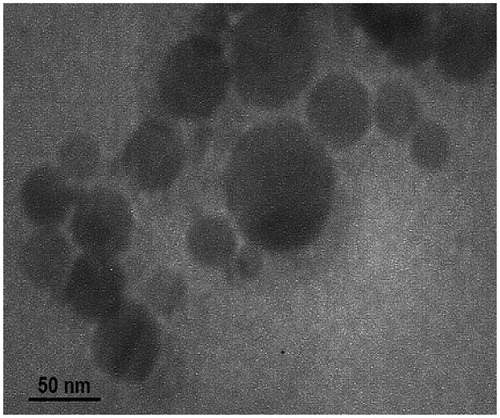
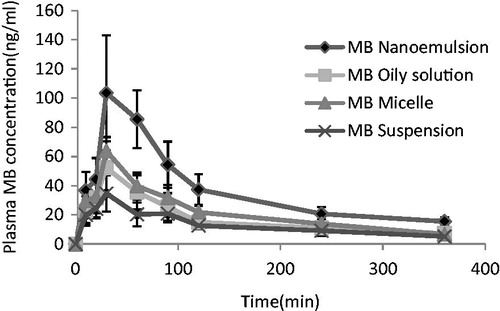
Figure 6. Drug-concentration time profiles of various mebudipine (MB) formulations after oral administration to rats (n = 6, dose = 10 mg/kg).