Figures & data
Figure 1. The schematic illustration of floating hydrogel delivery system encapsulating perfluoropentane.
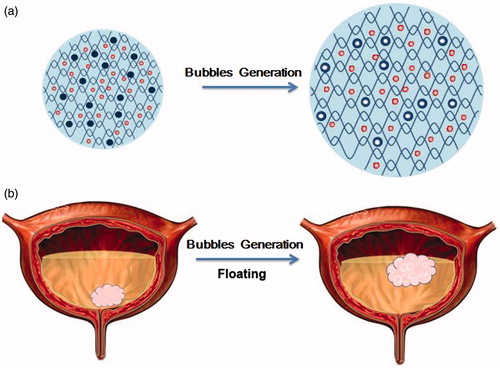
Figure 2. Characterizations of floating hydrogel. (a) Bubbles in hydrogels under microscope; (b) bubbles in hydrogel solution detected by ultrasound and (c) bubbles in hydrogel solution detected by scanning electronic microscope.
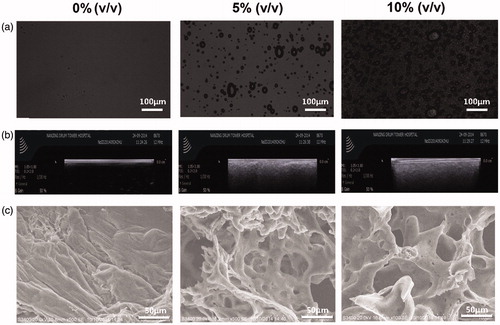
Figure 3. Change of gel volume with the perfluoropentane of different concentration. (a) Swelling process of gels encapsulating 0%, 5% and 10% PFP recorded by camera at 37 °C; (b) histogram of the volume changes; (c) swelling process of gels encapsulating 0%, 5% and 10% PFP recorded by camera at 20, 30, 37 °C; (d) histogram of the volume changes.
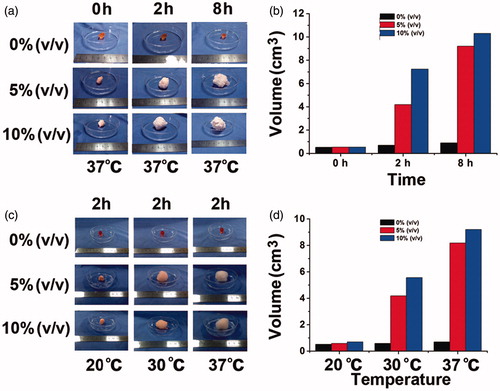
Figure 4. (a) Floating process of gels encapsulating 0%, 5% and 10% PFP recorded by camera at 37 °C; (b) time to float of gels at 37 °C; (c) erosion time of gels at 37 °C; (d) time to float of gels at 20, 30 and 37 °C.
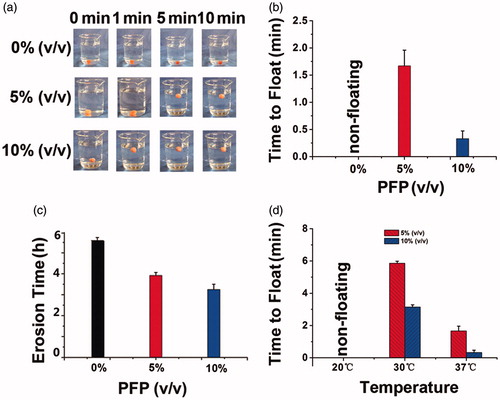
Figure 5. Cumulative release of DOX-loaded non-floating hydrogel and DOX-loaded floating hydrogel in vitro (mean ± SD, n = 3).
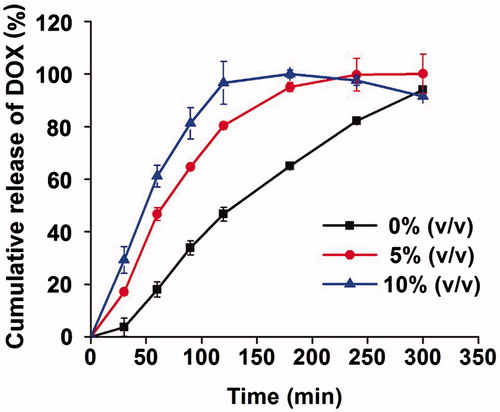
Figure 6. Process of intravesical injection of floating hydrogel into the rabbit bladder (detected by ultrasound). The white dashed curves in the pictures represented the rabbit bladder wall. The white dashed circles represented gels in rabbit bladder.
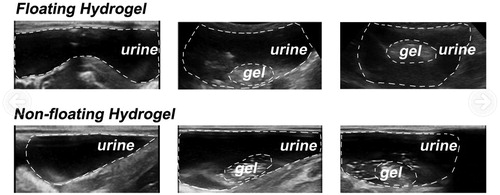
Figure 7. Drug release of floating hydrogel and non-floating hydrogel in vivo (mean ± SD, n = 3).
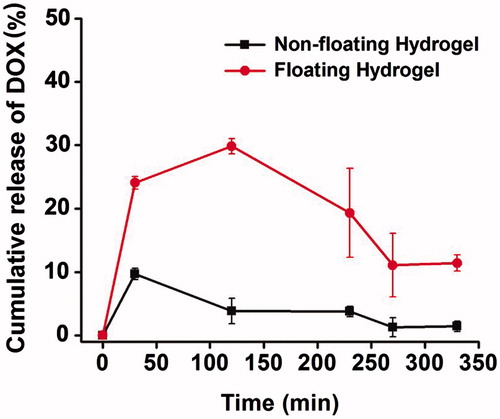
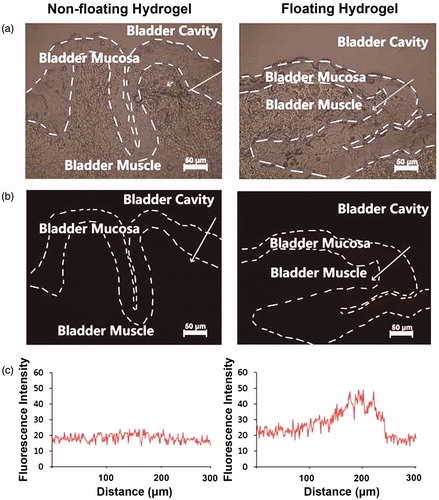
Figure 8. The frozen section was prepared immediately after isolating rabbit bladder tissues. The fluorescence of DOX was mainly distributed in the mucosa of bladder tissue, where the bladder cancer and interstitial cystitis invaded. The fluorescence intensity of the floating hydrogel group was greater than the non-floating hydrogel group.