Figures & data
Figure 1. Characteristics of the BLSM. Size distribution of BLSM as determined by dynamic light scattering (A). Transmission electron microscope (TEM) image of BLSM in 100 nm scale (B). Baohuoside I release profiles from the micelles in vitro in a PBS (PH7.4) (C). Data are presented as the mean ± SD (n = 3). (BLSM, baohuoside I-loaded mixed micelles composed of lecithin and Solutol HS 15).
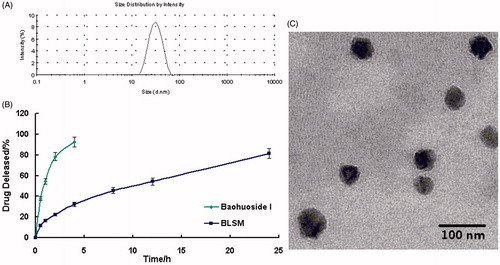
Table 1. Physicochemical characterizations of baohuoside I-loaded micelles (n = 3).
Table 2. IC50 values (μg/mL) of free baohuoside I or BLSM against A549 cells (n = 6).
Figure 2. Cellular uptake efficiency of the baohuoside I and BLSM by A549 cells after 1, 2, and 4 h incubation (A). The results were presented as the mean ± SD (n = 6). **p < 0.01, compared with baohuoside I group. Fluorescence microscope of A549 cells after 2 h incubation with the free fluorescent coumarin-6 and the coumarin-6-loaded mixed micelles (B). (BLSM, baohuoside I-loaded mixed micelles composed of lecithin and Solutol HS 15).
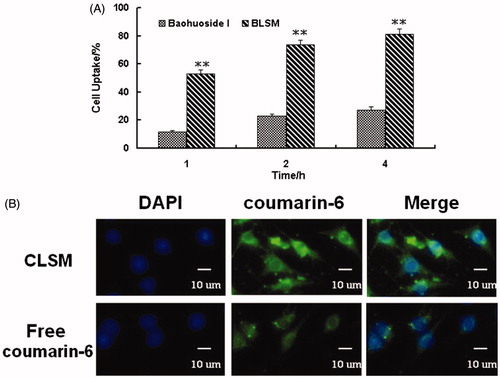
Figure 3. In vivo antitumor study of BLSM in Balb/c nude mice implanted with A549 cells. Tumor volumes (A) and body weight (B) were monitored daily. Tumor weight (C) and organ index (D) were monitored at the end of the experiment. The results were presented as the mean ± SD (n = 6). *p < 0.05, **p < 0.01, compared with the control group.
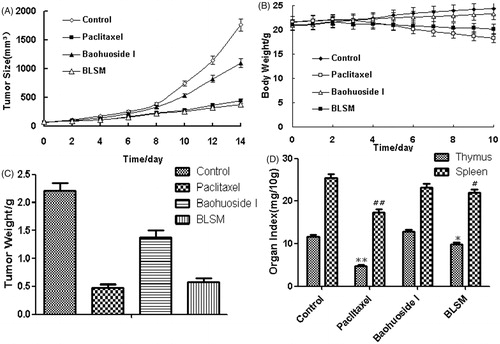
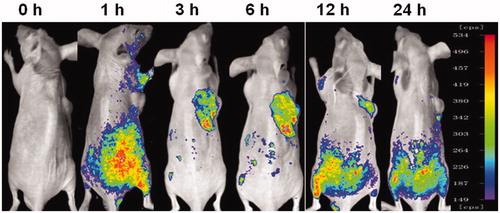
Figure 4. Fluorescence images of the mice-bearing A549 cells on right sides at different time points after intravenous injection of DiR-loaded mixed micelles.