Figures & data
Figure 1. PEA microspheres were prepared via an emulsification protocol. (A) Chemical structure of the poly(ester amide) (PEA) used as a building block for our PEA microspheres. (B) Schematic illustration of the formulation of PEA microspheres employing a water-in-oil-in-water (W1/O/W2) technique. (C) Optical and fluorescent microscopy images of PEA microspheres loaded with FITC-conjugated BSA (magnification 200×). A loading efficiency of > 85% was achieved.
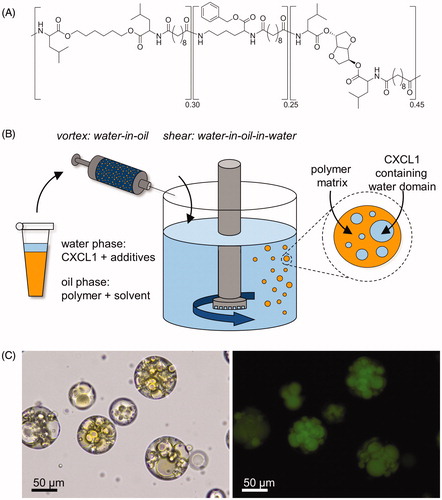
Figure 2. Scanning electron microscopic visualization and size distribution of PEA microspheres. (A) A microsphere ensemble and (B) the surface of a single PEA microsphere, showing evident surface pores (magnification 570× and 2350×, respectively). (C) Size distribution histogram, displaying a normal distribution with a mean of 57.2 μm and a standard deviation of 17.7 μm. D'Agostino & Pearson omnibus normality test; p = ns.
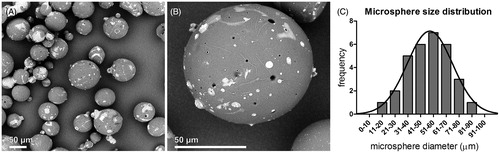
Figure 3. Proliferation of HMVECs in the presence and absence of PEA microspheres. The microspheres do not exhibit cytotoxic effects. n = 4 per time point per condition; rANOVA; p = ns.
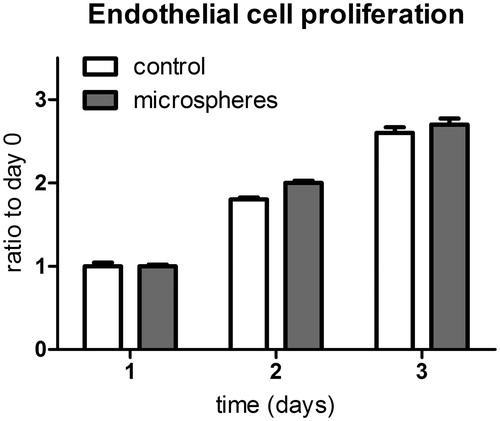
Figure 4. Microsphere release versus endogenous production of CXCL1. (A) Cumulative CXCL1 release from PEA microspheres over the course of 28 d, showing a marked burst release of the incorporated chemokine followed by a period of sustained long-term protein dispensation. CXCL1 release from microspheres is a 100-fold higher than endogenous CXCL1 production in ligated hind limbs. n = 3. (B) Endogenous CXCL1 production in ligated and contralateral murine hind limbs, displaying increase of CXCL1 production in the ligated leg compared with the non-ligated leg. n = 2; ANOVA; *p < 0.05 compared with thigh musculature of the ligated leg.
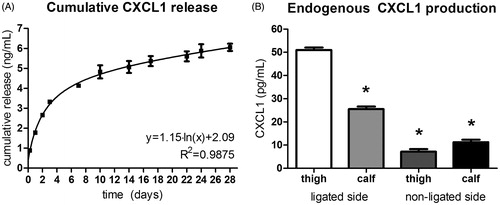
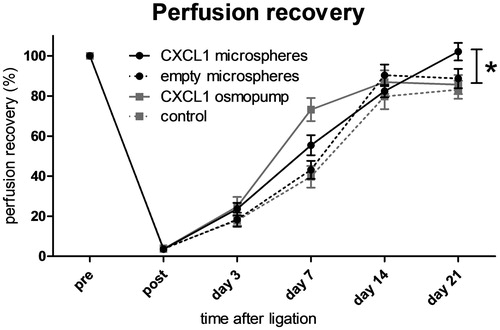
Figure 5. Perfusion recovery after femoral artery ligation in mice treated with either saline, continuous CXCL1 infusion, non-loaded microspheres, or CXCL1-loaded microspheres. Continuous CXCL1 infusion and CXCL1-loaded microsphere injection enhance perfusion recovery at day 7 compared with both saline and empty microsphere conditions. CXCL1-loaded microspheres show enhanced perfusion recovery compared with all other groups at day 21 after ligation. n = 8–9; rANOVA; *p < 0.05.