Figures & data
Figure 1. Synthesis of thio-poly acrylic acid mediated by carbodiimde via amide bond formation between poly acrylic acid and cysteine. 1% (m/v) PAA solution, pH 6 was incubated with 1 g EDAC, after 20 min incubation time, 1 g cysteine was added and pH readjusted to 6. The reaction mixture was stirred for 3 h.
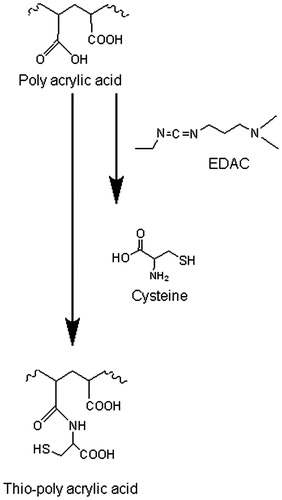
Figure 2. FT-IR spectra of unmodified (gray color) and thio-poly acrylic acid (black color), respectively.
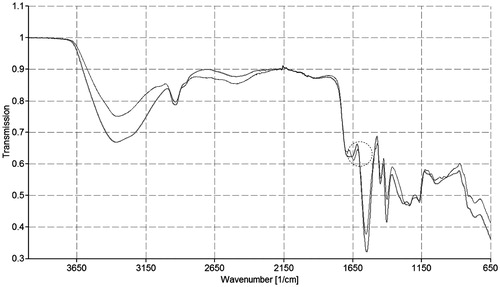
Figure 3. Resazurin assay. Cell viability was measured within 3 h (white bars) and 24 h (black bars) of incubation with testing polymers, unmodified and thio-poly acrylic acid, respectively. Indicated values are means (±SD) of at least three experiments.
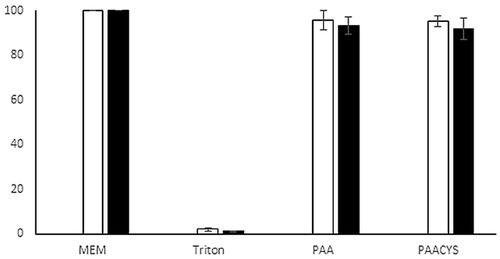
Figure 4. Water uptake study of unmodified PAA (open dot) and PAACYS (gray dot) discs in artificial saliva pH 6.75 at 37 °C. Indicated values are means (±SD) of at least three experiments.
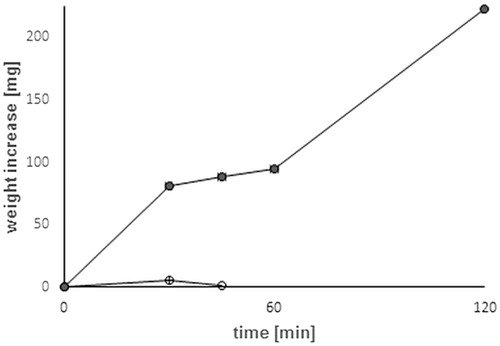
Figure 5. Erosion study of unmodified PAA and thio-poly acrylic acid. Indicated values are means (±SD) of at least three experiments (*p< 0.05 compared to control).
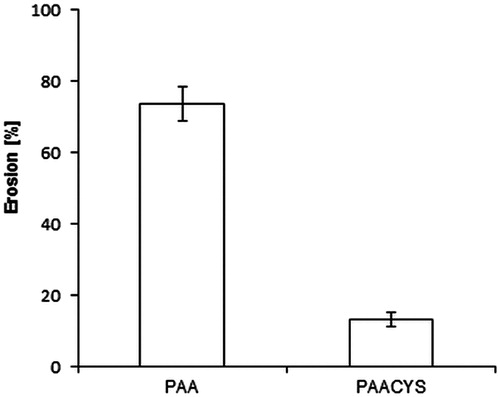
Figure 6. Overview of the disintegration behavior of unmodified and thio-poly acrylic acid. The indicated disintegration time represents an average of at least five experiments (±SD) (*p< 0.05 compared to control).
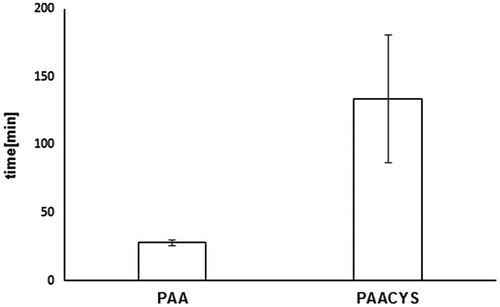
Figure 7. Comparison of mucoadhesive properties according to rotating cylinder assay. Test discs (30 mg) based on unmodified and thio-poly acrylic acid. Indicated values are the means (±SD) of at least five experiments (*p< 0.05 compared to control).
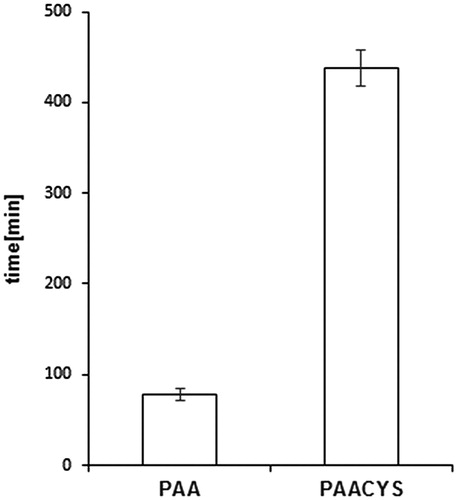
Figure 8. Evaluation of strength studies representing the mucoadhesiveness of PAA and PAACYS. Black bars represent the TWA and white bars represent the MDF, respectively. Indicated values are the means (±SD) of at least five experiments (*p< 0.05 compared to control).
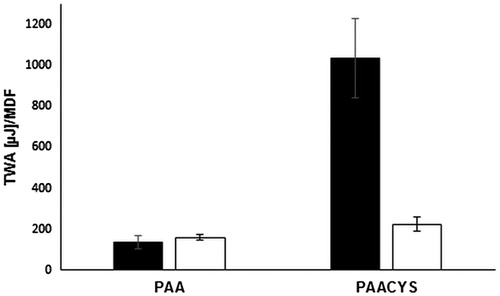
Figure 9. Bioadhesion assay. Mucoadhesive properties were studied according to bioadhesion assay. Test discs were attached to the buccal mucosa. Indicated values are the means (±SD) of at least five experiments (*p< 0.05 compared to control).
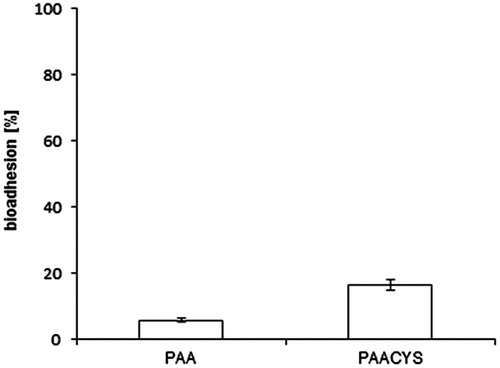
Figure 10. Residence time of unmodified (PAA) and modified (PAACYS) poly acrylic acid polymer discs (30 mg) on agar–mucus solution after incubating for 20 min. Using the modified tablet disintegration test apparatus in salvia buffer pH 6.75 at 25 °C. Indicated values are means (±SD) of at least three experiments (*p< 0.05 compared to control).
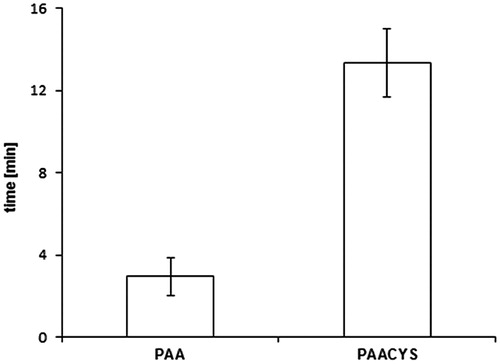
Figure 11. (a) Comparison of the η* of unmodified (triangle) and thio-poly acrylic acid (square) at 0 h, 2 h, 4 h at 37 °C. Indicated values are means (±SD) of at least three experiments (*p< 0.05 compared to control). (b) Storage modulus G′ of 0.2% unmodified (PAA) and modified (PAACYS)–mucus after 30 min. Indicated values are means (±SD) of at least three experiments (*p < 0.05 compared to control). (c) Loss modulus G′′ of 0.2% unmodified (PAA) and modified (PAACYS)–mucus after 30 min. Indicated values are means (±SD) of at least three experiments (*p< 0.05 compared to control).
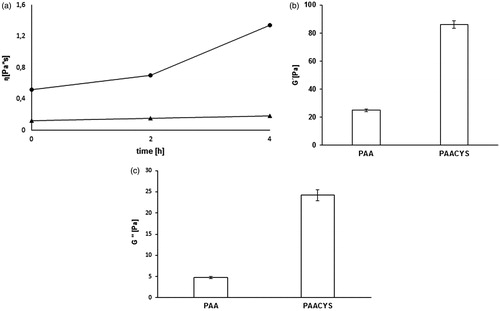
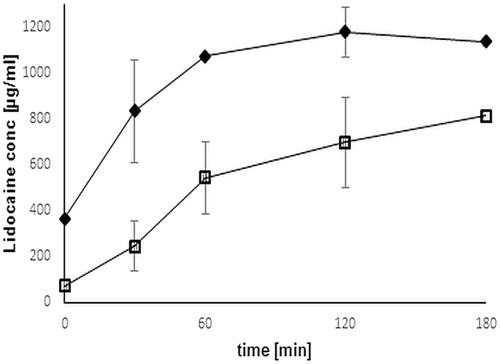
Figure 12. Comparison of release profile of Lidocaine from unmodified (black rhomb) and thio-poly acrylic acid (open square) discs. Release studies were performed in simulated saliva fluid buffer pH 6.75 at 37 °C. The indicated release time represents an average of at least three experiments (±SD) (*p< 0.05 compared to control).