Figures & data
Figure 1. The schedule of preparing DOX/FA-PEG-P(HB-HO) NPs.
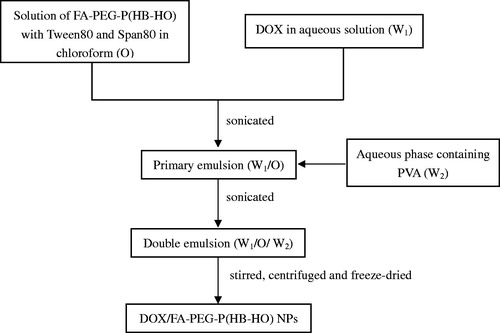
Table 1. Factors and levels of the orthogonal design L9 (34).
Table 2. Design of orthogonal design L9 (34).
Figure 2. Particle size and distribution of DOX/FA-PEG-P(HB-HO) NPs.
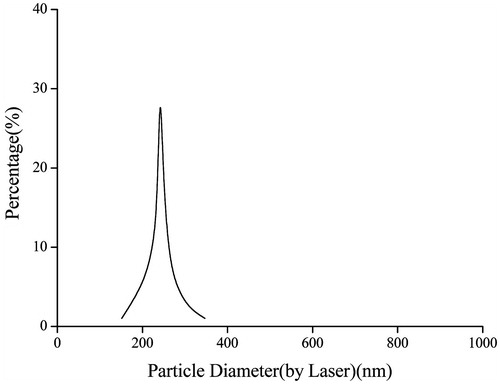
Figure 3. In vitro release study of DOX/FA-PEG-P(HB-HO) NPs. (A) In vitro cumulative release of DOX from DOX/FA-PEG-P(HB-HO) NPs in pH 7.4 PBS, (B) Higuchi model of DOX/FA-PEG-P(HB-HO) NPs, (C) zero-order model of DOX/FA-PEG-P(HB-HO) NPs and (D) first-order model of DOX/FA-PEG-P(HB-HO) NPs.
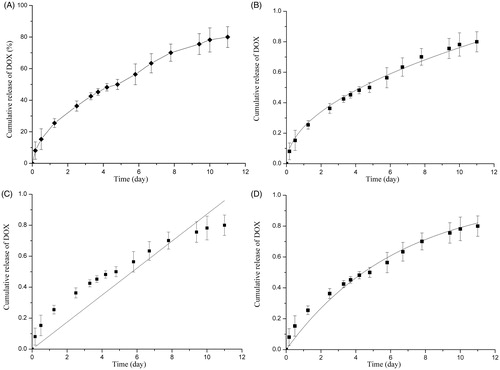
Table 3. Fitting of drug release data of optimized formulation according to various models.
Figure 4. Observation of HeLa cells in different groups by optical microscope. (A) control group; (B) free DOX group; (C) DOX/P(HB-HO) NPs group and (D) DOX/FA-PEG-P(HB-HO) NPs group. The black line represents a distance of 100 μm.
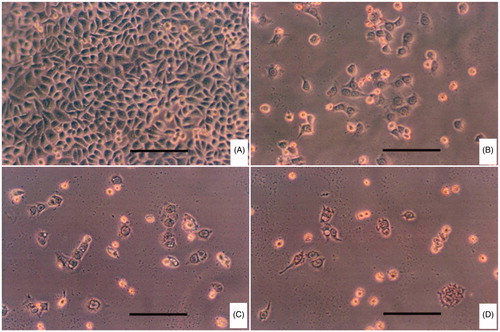
Figure 5. Observation of HeLa cells in different groups by fluorescence microscope. (A) control group; (B) free DOX group; (C) DOX/P(HB-HO) NPs group and (D) DOX/FA-PEG-P(HB-HO) NPs group.
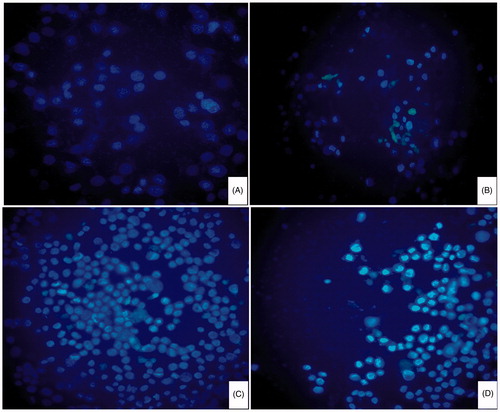
Table 4. The results of in vivo antitumor activity.
Table 5. Organ/body weight ratios of different groups.
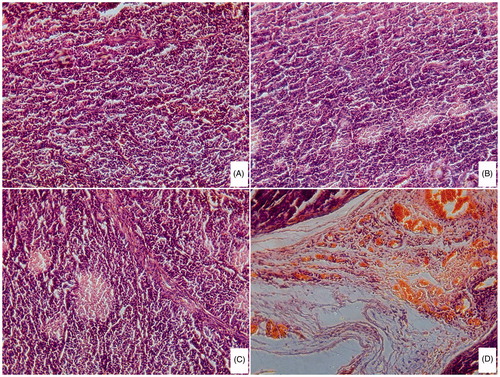
Figure 6. Photomicrograph of tumors in different groups after mice sacrifaced (H&E stain). Magnification, 200×. (A) Normal saline group; (B) free DOX group; (C) DOX/P(HB-HO) NPs group and (D) DOX/FA-PEG-P(HB-HO) NPs group.