Figures & data
Figure 1. Reaction scheme for the synthesis of SNA. 1st step: synthesis of an alginate-glutathione conjugate. 2nd step: nitrosation of alginate-glutathione conjugate.
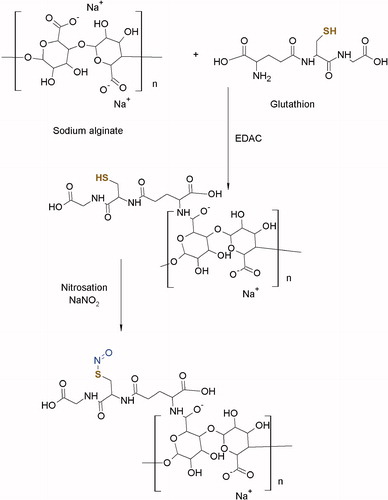
Table 1. Amount of glutathione (SH groups) determined by Ellman’s test (precursor of SNA F1).
Table 2. Amount of glutathione (SH groups) determined by Ellman’s test (precursor of SNA F2).
Table 3. Amount of nitrites determined by the Griess and Saville tests.
Figure 2. Stability of SNA F1 ![]()
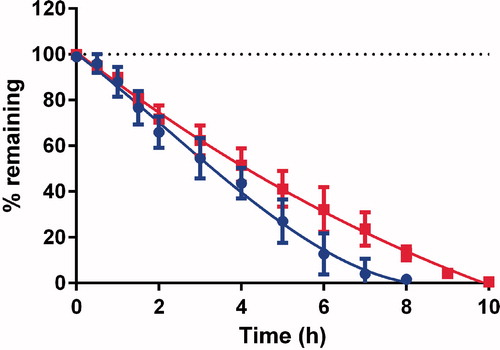
Figure 3. Stability of SNA F2 at different pH conditions at 4 °C in dark pH 1.2 ![]()
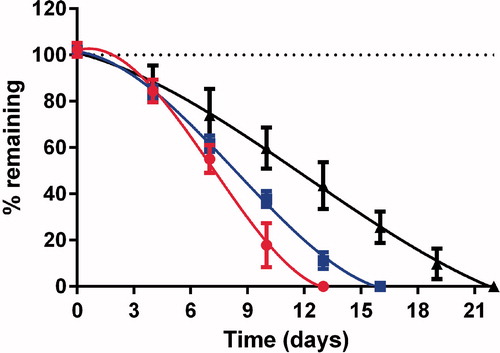
Figure 4. Concentrations of GSNO ![]()
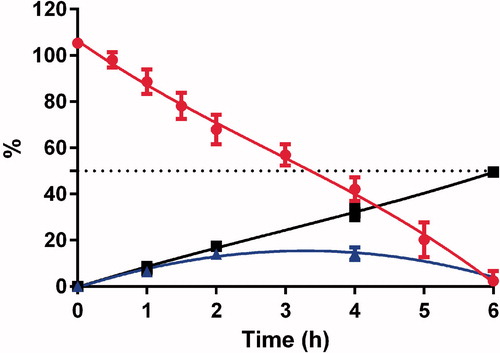
Figure 5. Concentrations of GSNO ![]()
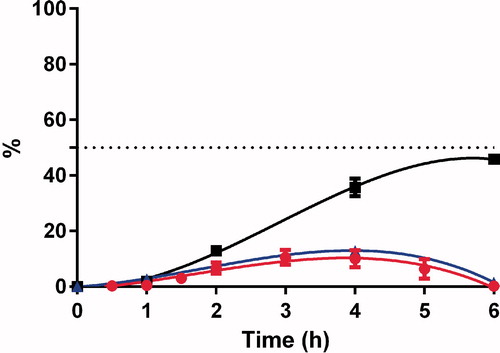
Figure 6. Concentrations of SNA F2 ![]()
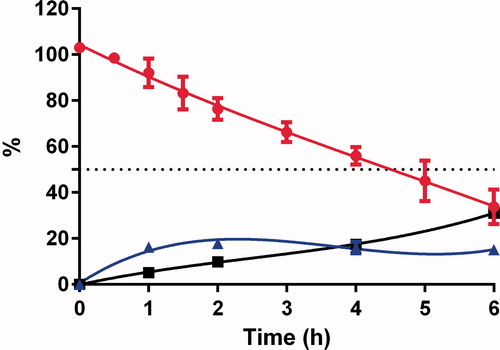
Figure 7. Concentrations of SNA F2 ![]()
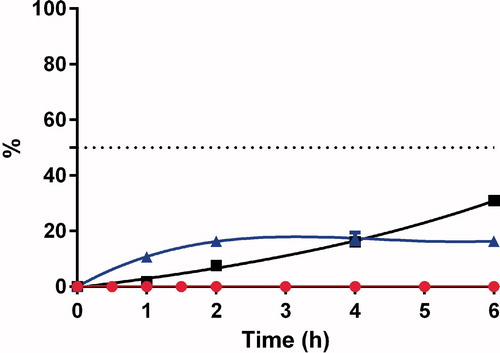
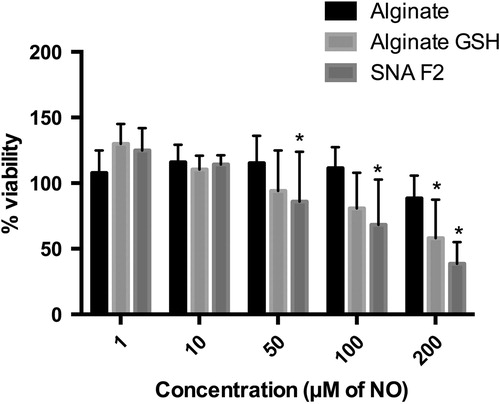
Figure 8. Cell viability of Caco2 cell line after exposure to different concentrations of alginate, alginate-GSH conjugate and SNA F2 (n = 3, mean ± SD). For SNA F2, the concentrations are expressed in μM of NO; for the other polymers, corresponding concentration are used. *Kruskal–Wallis test (comparison with alginate): p < 0.05.