Figures & data
Figure 1. Chemical structure of (a) betamethasone sodium phosphate and (b) polysiloxane reactive softener.
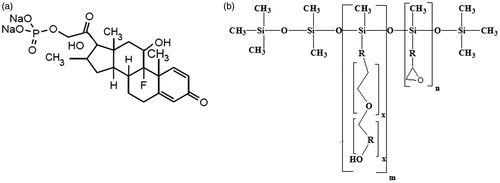
Table 1. Structural parameters of SBA-15-NH2 (Ghasemnejad et al., Citation2015).
Table 2. Preparation of various fabric samples.
Figure 2. Flow cytometry results for the determination of living PBMCs % after being treated and incubated for 24 h with 50 μg/ml SBA-15-NH2 and SBA-15-NH2-BSP at 37 °C, with respect to the untreated control cells.
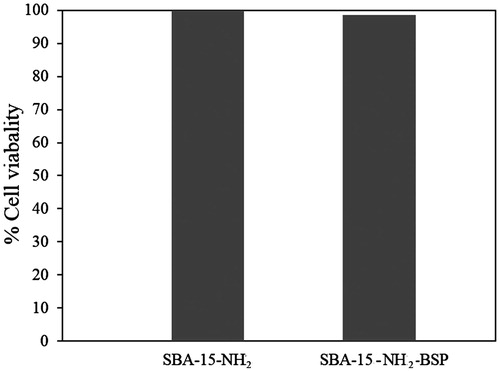
Figure 3. (a) Drug release profile of treated cotton samples and (b) Higuchi model of BSP release from sample S2 and S4.
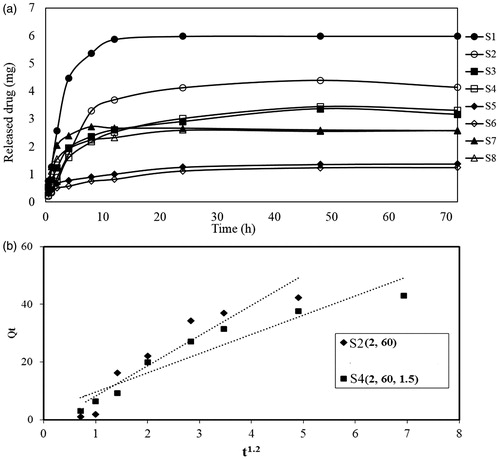
Table 3. BSP release kinetic parameters for Sample S2 and S4.
Table 4. Bending length of the treated samples.
Figure 4. SEM images of sample SBA-15-NH2-BSP particles (a), untreated cotton fabric (b), sample S2 (c and d) and sample S4 (e and f).
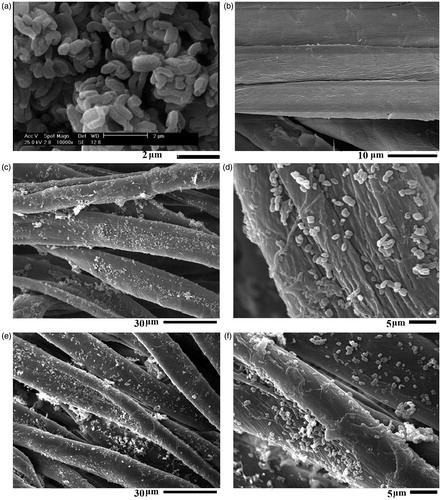
Figure 5. SEM images of sample S4 after five washing cycles.
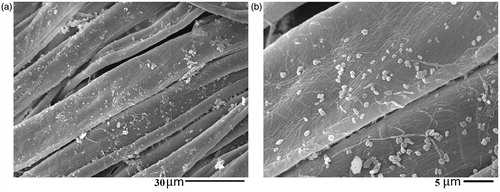
Table 5. Tensile strength of different sample.
Table 6. Air permeability of different sample.
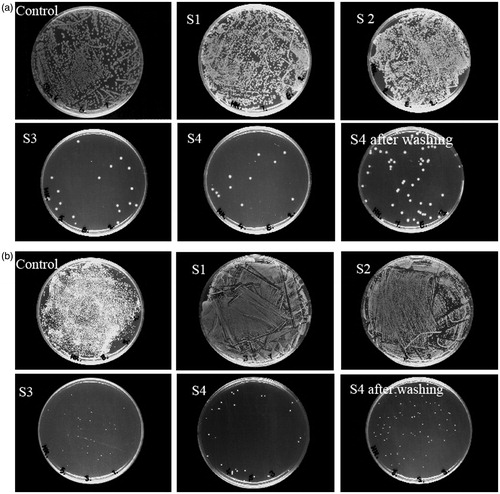
Figure 6. Antibacterial properties of the treated sample against (a) E. coli and (b) S. aureus.