Figures & data
Figure 1. Presentation of PEGDGA copolymer and PAMAM–PEGDGA synthesis.
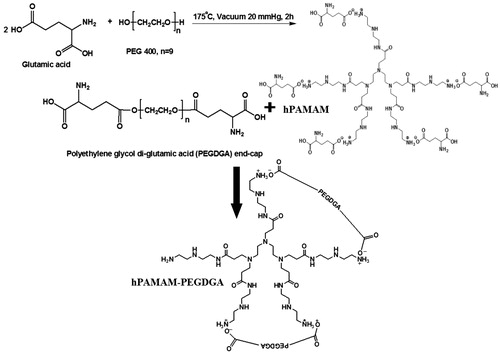
Figure 2. GPC chromatogram of PEGDGA copolymer (A) 1H NMR spectrum of hPAMAM–PEGDGA (B). The percentage of PEGDGA copolymer attachment to hPAMAM was calculated from the integral ratio of –NHCH2CH2– (C/c, 2.0–3.2 ppm) to PEG (i, 3.7 ppm), by the following formula, hPAMAM–PEG= 2(C/c)/3(i)).
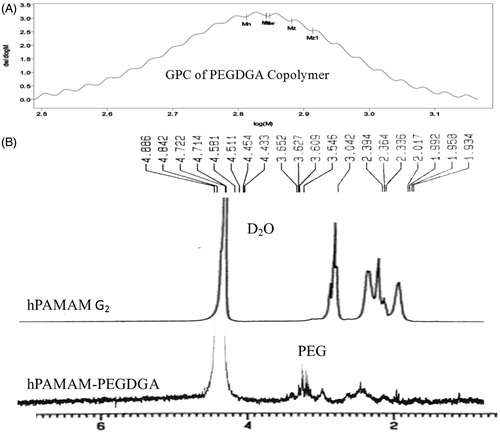
Table 1. GPC parameters of PEGDGA copolymer.
Figure 3. (A) AFM images with 3D view of the nanoparticle complexes, image of hPAMAM–PEGDGA/pDNA (120 nm) (complex at a weight ratio of 10). (B) hPAMAM–PEGDGA encapsulated DNA showed stability against DNase I for up to 120 min, while the naked DNA was fully degraded in 30 min.
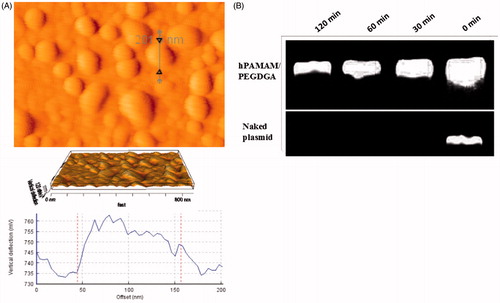
Table 2. Particle size and zeta potential of hPAMAM and PAMAM-PEGDGA with or without DNA (n = 3).
Figure 4. Cell viability of hPAMAM and hPAMAM–PEGDGA. (A) Cell viability on 4 h after treatment by nanoparticles (Lipofectamine, PAMAM-G4, hPAMAM, hPAMAM–PEGDGA) in MCF7 (A) and MDA-MB231 (B) cell lines at various polymer concentration.
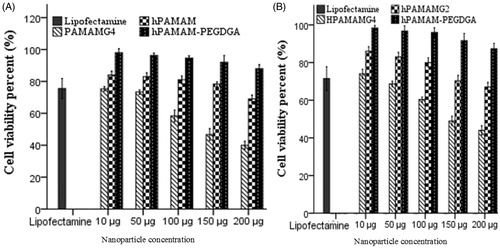
Figure 7. Quantification of luciferase expression in MCF7 and MDA-MB231 cells. Luciferase activity was measured 48 h post-transfection with different complexes (Lipofectamine, hPAMAM/DNA and hPAMAM–PEGDGA/DNA) for 4 h as described before, and was expressed as light units per mg protein. ∗, p < 0.05 between group; †, p < 0.05 versus Lipofectamine (as control). Data represent the mean ± SD (n = 3).
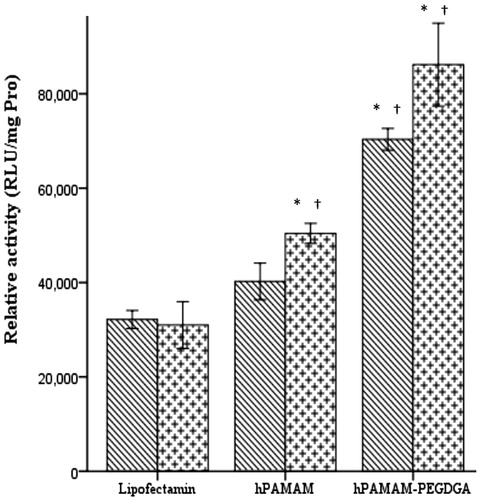
Figure 5. Fluorescent microscopy and flow cytometry analysis data. Cellular uptake of BODIPY-labeled hPAMAM–PEGDGA in the concentration of 1, 2, 4 and 8 μm in MCF7 (A–E) and MDA-MB231 (E–H) cells and the data of both cells showed in figure (J). Cellular uptake of BODIPY-labeled hPAMAM–PEGDGA complex and PAMAM-G4 in the concentration of 1 μm (I). The number of BODIPY-positive cells was analyzed by setting a gate according to the control. Green: BODIPY.
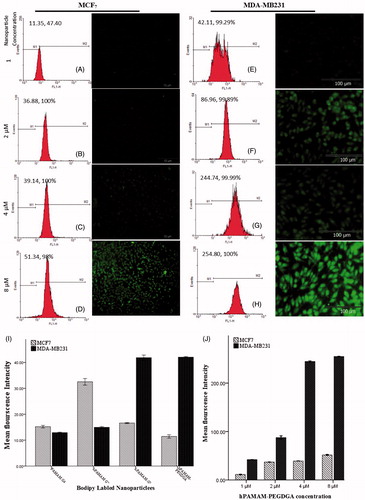
Figure 6. Cellular uptake of hPAMAM/DNA in the concentration of 8 μm (A), hPAMAM–PEGDGA/DNA NPs in the concentration of 1, 4 and 8 μm on MCF7 cells after a 30-min incubation (B–D). The weight ratio of PAMAM to DNA was 10:1. Results were performed as fluorescent microscopy images. Red: EMA-labeled DNA. Original magnification: 100×.
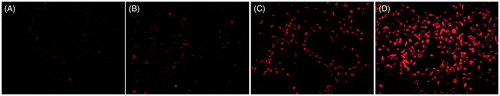
Figure 8. Gene expression on MDA-MB231 cells. The fluorescence images of GFP expression were taken 48 h post-infection with hPAMAM–PEGDGA/DNA in the different concentrations: (A) No treated, (B) 2 μm, (C) 4 μm, (D) 8 μm. Magnification: 100×. Results were performed as fluorescent microscopy images.
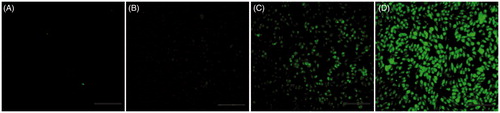
Figure 9. Intracellular tracking hPAMAM–PEGDGA/DNA NPs in MDA-MB231 cells. Images were taken after incubated with NPs for 15 min (A–D) or 60 min (E–H). Red: EMA-labeled DNA; Green: LysoTracker Green.
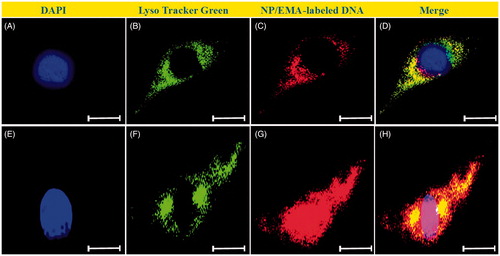
Figure 10. In vivo imaging of mice treated by hPAMAM/DNA NPs (A) or PAMAM–PEGDGA/DNA NPs (B). Images were taken 120 min after NPs injection. (C) Semi-quantitative fluorescence intensity of brain and different organs. p value < 0.05.
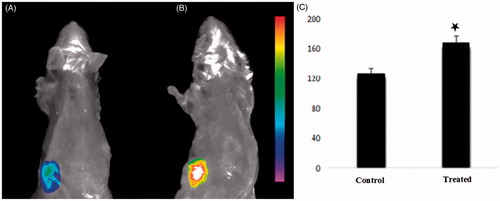
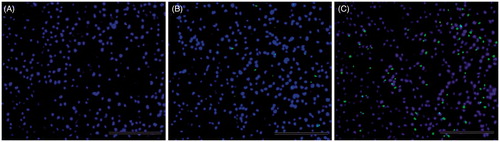
Figure 11. The qualitative evaluation of gene expression in vivo. Profile of gene expression in breast tumor tissue of Balb/c mice treated with naked plasmid (A), hPAMAM/DNA NPs (B) and PAMAM–PEGDGA/DNA (C) complexes 48 h after i.v. injection. Frozen sections (thickness of 20 mm) of breast tumor tissue (A–C) were examined by fluorescent microscopy. The sections were stained with 300 nM DAPI for 10 min at room temperature. Green: GFP. Blue: cell nuclei. Original magnification: ×100.