Figures & data
Figure 1. Schematic illustration on the anti-metastasis efficacy of losartan in combination with paclitaxel-loaded pH-sensitive liposomes (PTX-Cl-Lip).
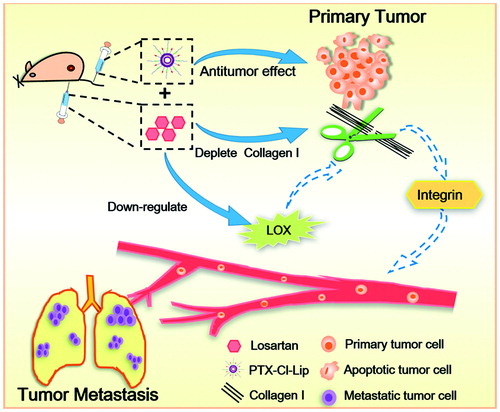
Figure 2. The basic characterizations of PTX-Cl-Lip. (A) The schematic diagram of PTX-Cl-Lip. (B) The size distribution of PTX-Cl-Lip. (C) The zeta potential distribution of PTX-Cl-Lip.
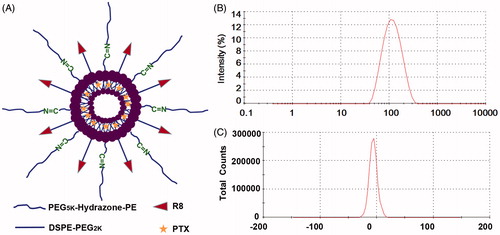
Table 1. The basic characterizations of Cl-Lip and PTX-Cl-Lip (mean ± SD, n= 3).
Figure 3. The combination of losartan and PTX-Cl-Lip depressed the lung metastasis in 4T1 bearing mice. (A) Body weight of mice treated with different preparations during the treatment (mean ± SD, n = 6). (B) Tumor growth curves of mice receiving different preparations during the treatment (mean ± SD, n= 6). (C) The average number of nodules in lungs for each group at the end of treatment (mean ± SD, n= 6). (D) The photographs of typical lungs for each group at the end of treatment. The area surrounded by white circles represented metastatic nodules in lungs (E) HE staining of lungs after treatment. Arrows pointed to the metastatic nodules in lungs. Scale bars represented 100 μm. (F) Masson staining of tumors after treatment. Arrows pointed to the collagen I in tumors. Scale bars represented 50 μm.
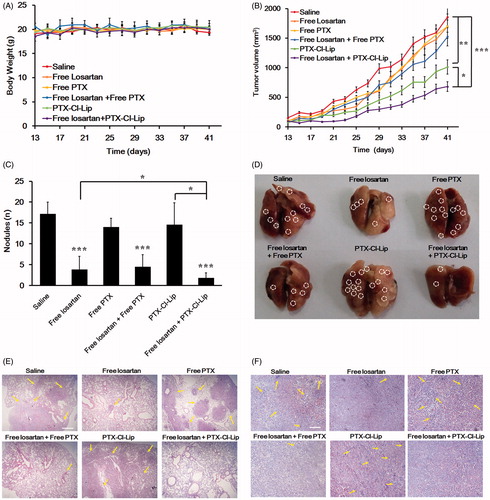
Figure 4. The network of collagen I and application of losartan modulated the invasion of the tumor cells which formed 4T1 tumor spheriods. (A) Typical inverted microscope images on the invasion of 3D tumor spheriods in BME and different concentrations of collagen I gels. (B) Typical inverted microscope images on the invasion of 3D tumor spheriods in 4 mg/ml collagen I gels mixed with different dosages of losartan. (C) Relative invasion distance of tumor spheriods incubated at different collagen I gels compared with those without incubation calculated by Image J (mean ± SD, n= 5–8). (D) Relative invasion distance of tumor spheriods incubated with different dosages of losartan compared with those incubated with 4 mg/ml collagen I gels free from losartan calculated by Image J (mean ± SD, n = 5–8). Scale bars represented 100 μm. *represented p < 0.05.
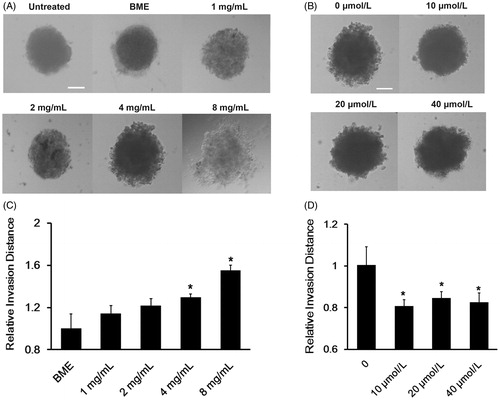
Figure 5. The combination of losartan and different PTX preparations modulated the invasion of tumor spheroids. (A) Typical inverted microscope images on the invasion of 3D tumor spheriods treated with different preparations. Scale bars represented 100 μm. (B) Relative invasion distance of tumor spheriods incubated with different preparations compared with those untreated by Image J (mean ± SD, n= 5–8). * and **represented p < 0.05 and p < 0.01, respectively.
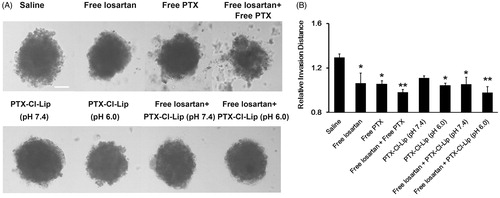
Figure 6. (A) Analysis of relevant proteins expression in tumor tissues after injection of different preparations by Western-blot assay. (B) Semi-quantitative result of the relevant proteins compared with GAPDH by Image J.
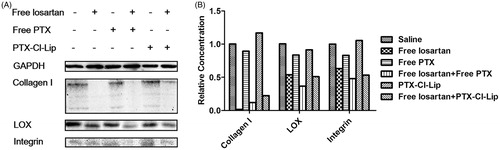
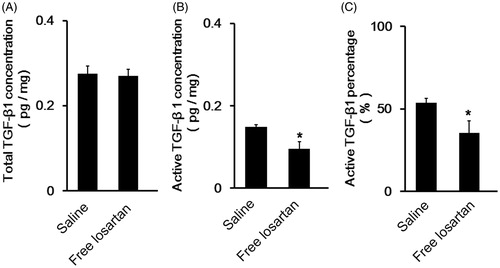
Figure 7. The detection of the activation of TGF-β1 in tumor tissues after administration of losartan. (A) The level of total TGF-β1 concentration in tumor tissues of 4T1 bearing breast cancer models (mean ± SD, n= 3). (B) The level of active TGF-β1 concentration in tumor tissues of 4T1 bearing breast cancer models (mean ± SD, n= 3). (C) The percentage of active TGF-β1 account for total TGF-β1 in tumor tissues (mean ± SD, n= 3).