Figures & data
Figure 1. SEM images of (A) NPs, (B) Pul NPs, (C) AGn NPs, and (D) Pul–AGn NPs.
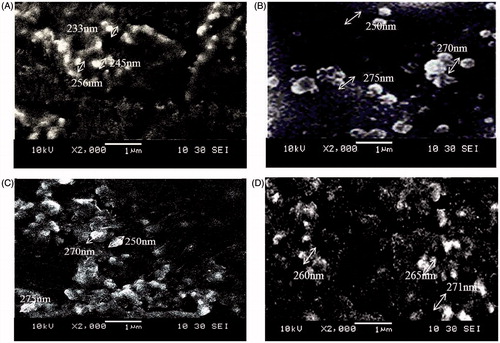
Figure 2. FTIR spectra.
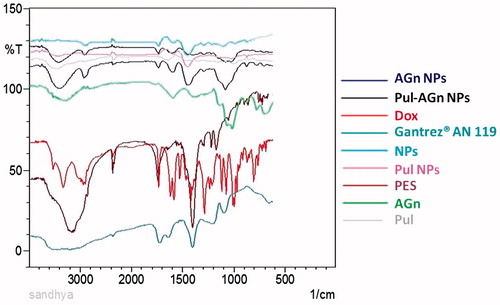
Figure 3. (A) Differential scanning calorimetry thermograms and (B) powder X-ray diffraction crystallographs of (1) Dox, (2) Gantrez® AN 119, (3) PES, (4) NPs, (5) Pul NPs (6) AGn NPs, and (7) Pul–AGn NPs.
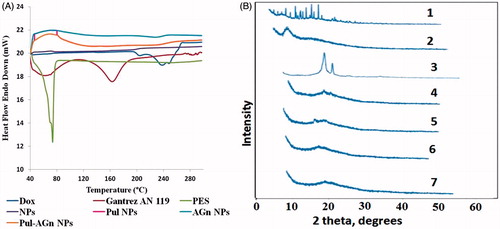
Figure 4. In vitro release of Dox from various Dox formulations (mean ± S.D.; n = 3). (A) Phosphate buffer, pH 7.4. (B) Acetate buffer, pH 5.5.
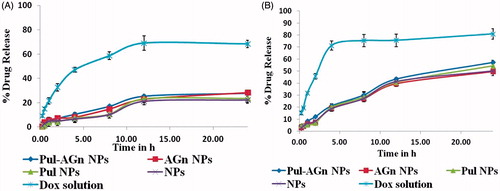
Table 1. Kinetic models for in vitro drug release.
Figure 5. (A) In vitro hemolysis and (B) In vitro serum stability of Dox nanoparticles (mean ± S.D.; n = 3).
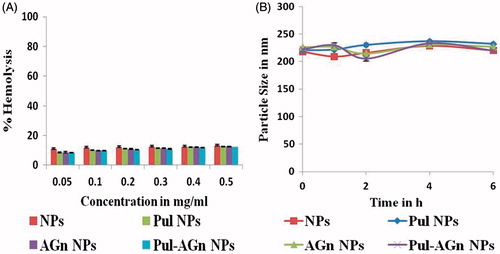
Figure 6. Plasma concentration versus time profiles of Dox following intravenous administration of Dox formulations (mean ± S.D.; n = 6).
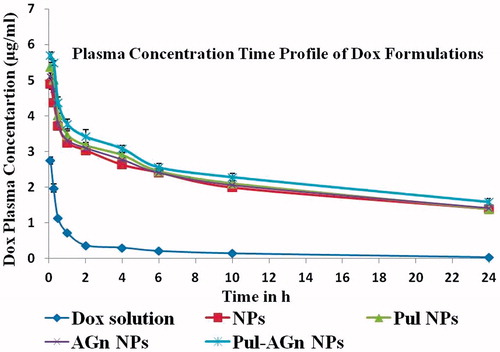
Table 2. Pharmacokinetic parameters of Dox solution, NPs, and carbohydrate-anchored NPs.
Figure 7. In-vitro cytotoxicity of Dox solution, NPs, and carbohydrate-anchored NPs in MCF-7 cell lines at 50 μg/ml of Dox (mean ± standard error, n = 3).
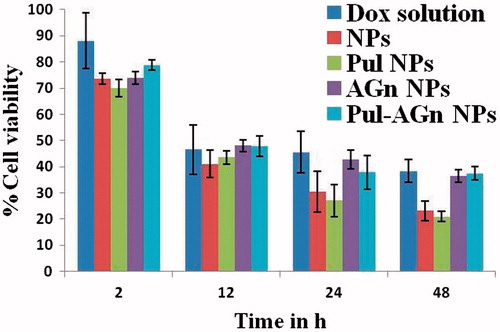
Figure 8. Tumor growth suppression in mice treated with Dox formulations (mean ± S.D.; n = 6).
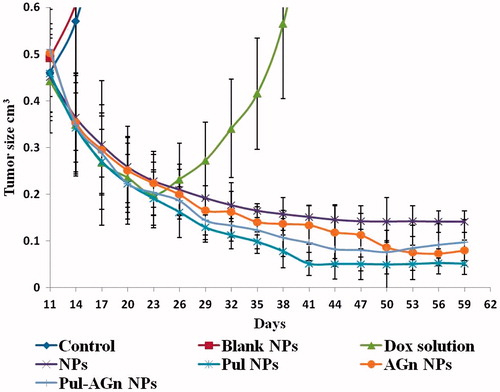
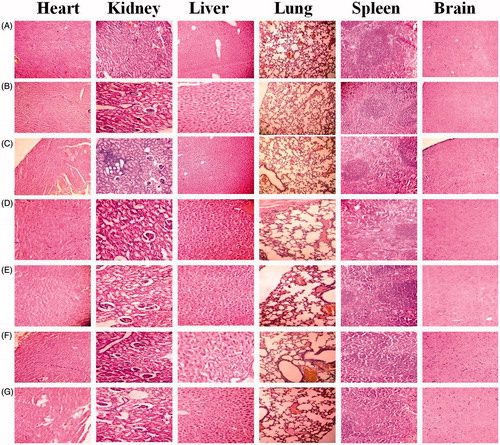
Figure 9. Representative histopathological images of heart, kidney, liver, lung, spleen, and brain of mice treated with (A) control; (B) blank NPs; (C) Dox solution; (D) NPs; (E) Pul NPs; (F) AGn NPs; (G) Pul–AGn NPs.