Figures & data
Table 1. Composition of different ODTs prepared by direct compression using different co-processed excipients.
Table 2. Physical evaluation of the ODT formulations.
Figure 1. In vitro dissolution profile of CLZ from different ODTs prepared by: (a) Pharmaburst®500; (b) Pearlitol flash®; (c) Starlac®; (d) Prosolv® odt and (e) F-melt®.
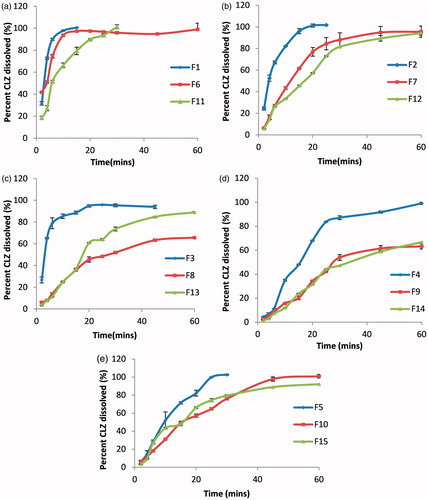
Table 3. Percent of CLZ dissolved after 15 min (Q15) of different ODTs.
Figure 2. DSC thermograms of CLZ, Pharmaburst® 500, MAG, Lubripharm® as well as selected ODT (F1).
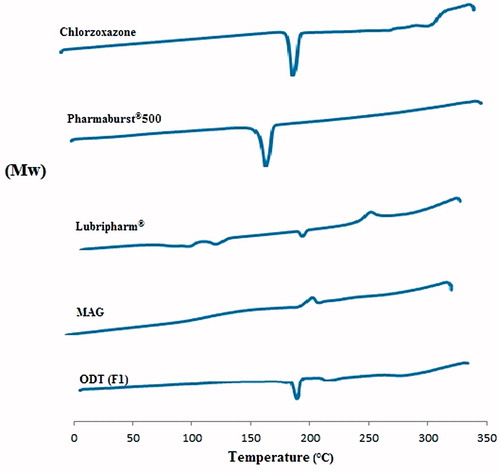
Figure 3. HPLC chromatogram of rabbit plasma spiked with CLZ.
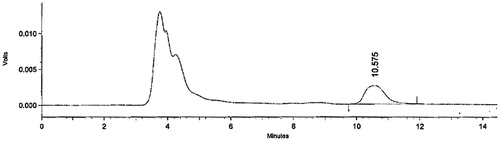
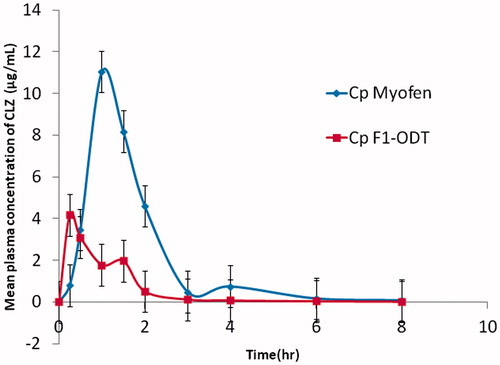
Figure 4. Mean plasma concentration of CLZ following the administration of ODT (F1) (50 mg) and oral administration of Myofen® capsule (250 mg) to 12 rabbits.