Figures & data
Figure 1. Anionic surfactants capable of precipitating desmopressin from aqueous solution. The surfactants likely formed an ion pair with the positively charged guanidine group.
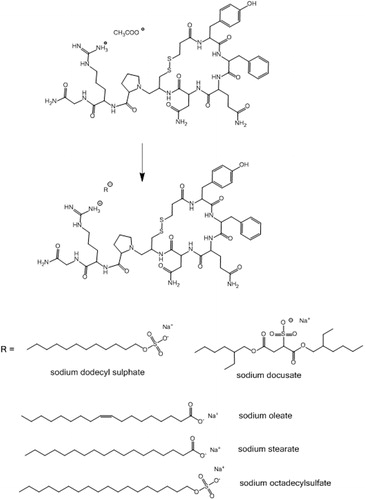
Table 1. Classification of lipid-based excipients used in the study.
Figure 2. Hydrophobic ion pairing of desmopressin acetate with sodium octadecyl sulfate (○), sodium stearate (▴), sodium dodecyl sulfate (□), sodium oleate (•), and sodium docusate (▪). After the addition of surfactants, the precipitated desmopressin complex was centrifuged and the amount of remaining peptide in supernatant determined by HPLC. Data are shown as mean ± SD (n = 3).
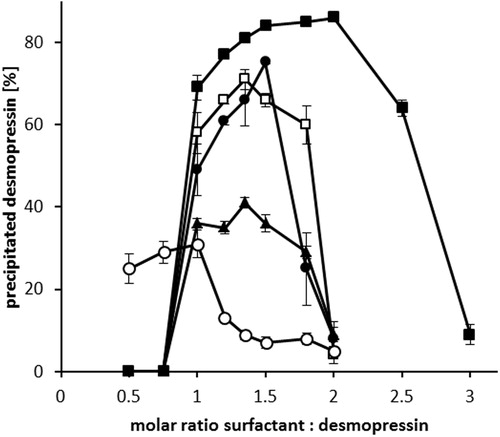
Figure 3. (A) Partitioning coefficient log P (Capmul 907 P/water) of DES/SOL (•), DES/AOT (▪) and DES/SDS (□). Surfactant solutions were added in a dropwise manner to desmopressin solution to precipitate the peptide-surfactant complex. After 5 min 100 μL of Capmul 907 P was added and the mixture stirred for 30 min. The amount of desmopressin in both phases was determined by HPLC. (B) Zoomed log P (Capmul 907 P/water) for DES/AOT (▪) and DES/SDS (□).
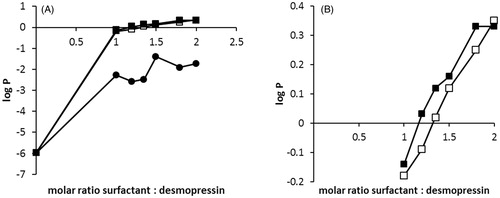
Figure 4. Solubility of desmopressin acetate (white bars) and DES/AOT (black bars) in chosen water insoluble lipids and surfactants after 48 h of incubation at 25 °C. Data are shown as mean ± SD (n = 3).
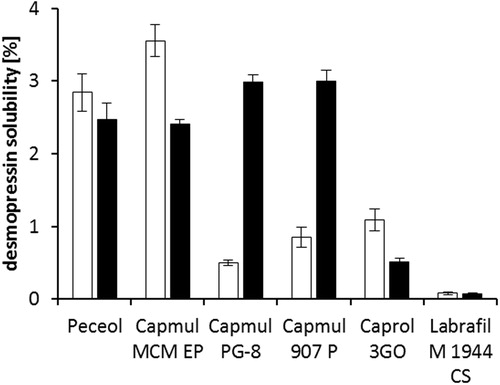
Table 2. SEDDS formulation development with Capmul 907P as main solvent.
Figure 5. Consumption of 0.1 M NaOH during in vitro digestion of SEDDS formulations F4 (○) and F15 (•) by pancreatic lipase at 37 °C. Data are shown as mean ± SD (n = 3).
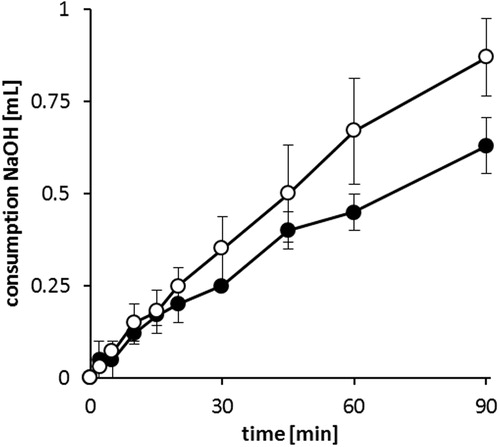
Figure 6. Degradation of desmopressin acetate (▪), DES/AOT-SEDDS-F15 (•) and DES/AOT-SEDDS-F4 (○) at 37 °C in 50 mM acetate buffer pH 5.5 by reduced glutathione. Data are shown as mean ± SD (n = 3).
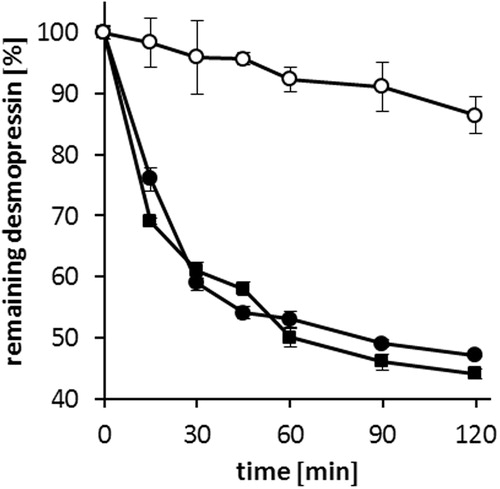
Figure 7. Enzymatic degradation of desmopressin acetate (▪), DES/AOT-SEDDS-F15, (•) and DES/AOT-SEDDS-F4 (○) at 37 °C in 50 mM HEPES buffer pH 7.4 with 2 mM CaCl2 by α-chymotrypsin. Data are shown as mean ± SD (n = 3).
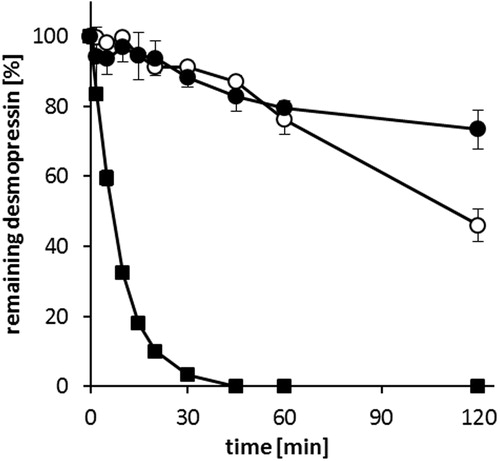
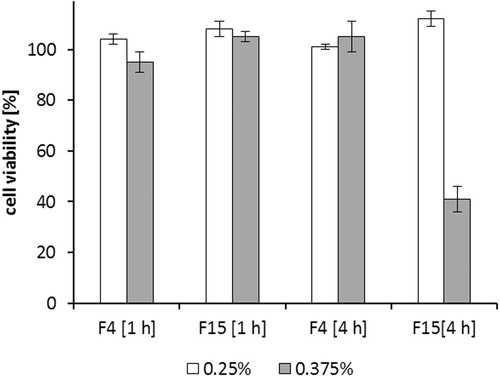
Figure 8. Cell viability rates of Caco-2 cells after incubation for 1 h and 4 h with 0.25% (w/v) and 0.375% (w/v) DES/AOT-SEDDS-F4 and DES/AOT-SEDDS-F15. Data are shown as mean ± SD (n = 3).