Figures & data
Table 1. Rf values of 99mTc-Aprotinin in mobile phases.
Figure 1. Radiolabeling efficiency and stability of 99mTc-Aprotinin at room temperature up to 6 h.
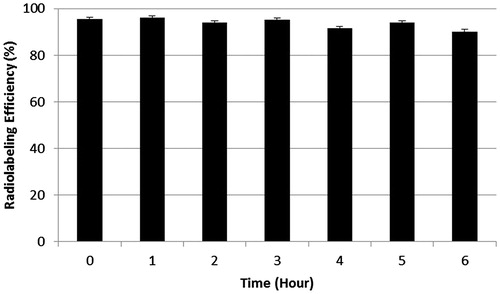
Figure 2. The scintigrams of 99mTc-Aprotinin-S and 99mTc-Aprotinin-M injected acute edematous, model induced rats at different time intervals up to 90 min (approximate organ regions for K: kidney, IS: injection site, L: liver, S: spleen).
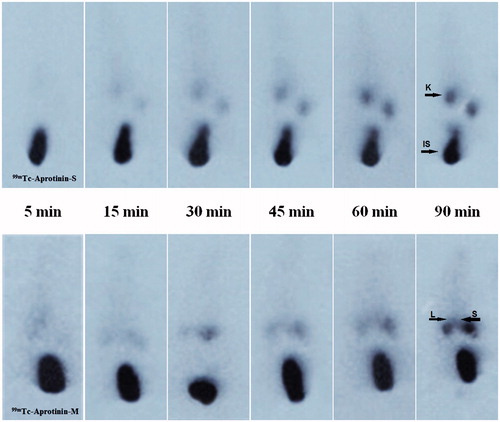
Figure 3. The scintigrams of 99mTc-Aprotinin-S and 99mTc-Aprotinin-M injected severe necrotizing pancreatitis model induced rats at different time intervals up to 90 min (approximate organ regions for K: kidney, IS: injection site, L: liver, S: spleen).
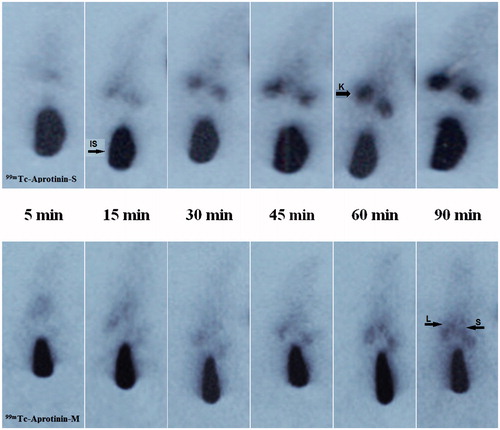
Figure 4. The scintigrams of 99mTc-Aprotinin-S and 99mTc-Aprotinin-M injected air pouch model induced rats at different time intervals up to 90 min (approximate organ regions for K: kidney, IS: injection site, L: liver, S: spleen).
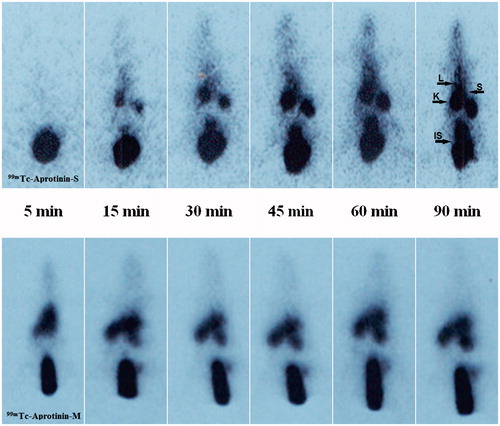
Figure 5. Calculated Organ/BG ratios of acute edematous (A), severe necrotizing pancreatitis (B) and air pouch model (C) induced rats after 99mTc-Aprotinin-S injection up to 90 min.
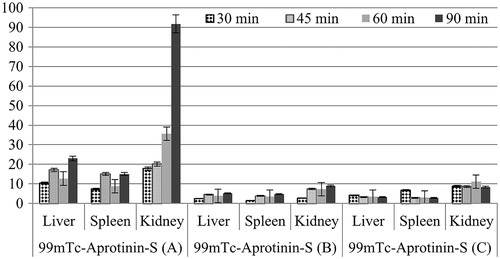
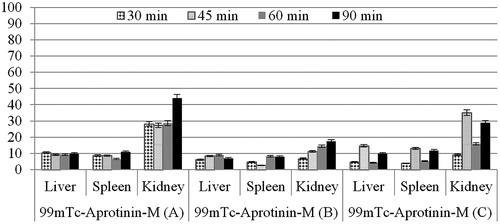
Figure 6. Calculated organ/BG ratios of acute edematous (A), severe necrotizing pancreatitis (B) and air pouch model (C) induced rats after 99mTc-Aprotinin-M injection up to 90 min.