Figures & data
Figure 1. Surfactin co-precipitating with INS to protect it from proteolytic degradation. (A) SDS-PAGE analysis of surfactin to protect INS from proteolytic degradation. INS with or without surfactin digested by pepsin at pH 1.2 or trypsin at pH 6.8. Lane M: molecular weight marker; Lane 1: INS alone; Lane 2: INS without surfactin digested by pepsin or trypsin; Lane 3: INS digested by pepsin or trypsin with surfactin. It was clearly shown that INS has been completely digested by pepsin (left panel, Lane 2) and partially digested by trypsin (right panel, Lane 2) in the absence of surfactin. (B) Fluorescent analysis of co-precipitates containing INS and surfactin after digestion by pepsin. FITC-INS (with or without surfactin) was treated with (+) or without pepsin (−) at pH 6.8 or 1.2, then the pepsin-digested precipitates were observed by CLSM. Surfactin forms co-precipitates with INS at pH 1.2 (top). Further analysis by CLSM verified that FITC-INS (indicated by dashed arrows) co-precipitates with non-fluorescent surfactin (indicated by solid arrows) at acidic pH values (bottom). (C) Co-precipitate efficiency (CE) of INS with surfactin. CE values are more than 86.08%, indicating that most of INS are precipitated in the co-precipitates.
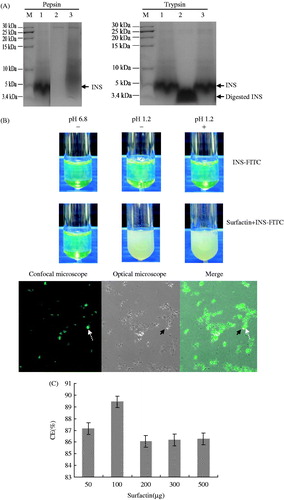
Figure 2. Non-reductive PAGE for analysis of INS binding with surfactin. INS was mixed with 1 mg/ml of surfactin. After mixing, smeary bands were found on the gel with larger molecular weights than INS (Lane 3 and 4, labeled with dashed rectangle), indicating that surfactin binds to INS to form heteropolymers. Lane 1: INS alone; lane 2: surfactin; lane 3: INS mixed with surfactin at pH 6.8; lane 4: INS mixed with surfactin at pH 1.2, then to 6.8 for redissolving.
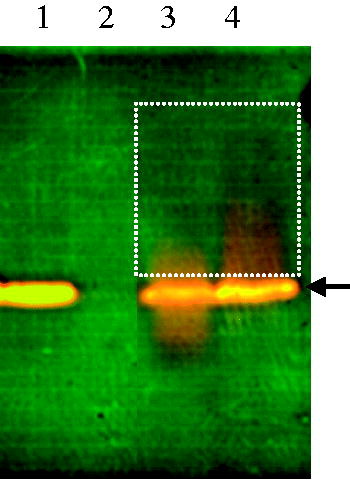
Figure 3. INS structure influenced by surfactin. INS was mixed with surfactin at pH 1.2 to form co-precipitates following to pH 6.8 for re-dissolving, then the CD or fluorescence spectrum was detected for analysis of INS structure influenced by surfactin. (A) CD spectrum of INS in the presence of surfactin. The ratio of surfactin to INS is 0.5:1, 1:1 and 2:1 (w/w), indicated by solid red, black and yellow line, respectively. (B) The fluorescence spectrum of INS in the presence of surfactin. P1: Surfactin; P2: INS; P3: INS mixed with surfactin at pH 1.2, then to 6.8; P4: INS mixed with surfactin at pH 6.8. The x-axis is wavelength (nm), and the y-axis is fluorescence intensity.
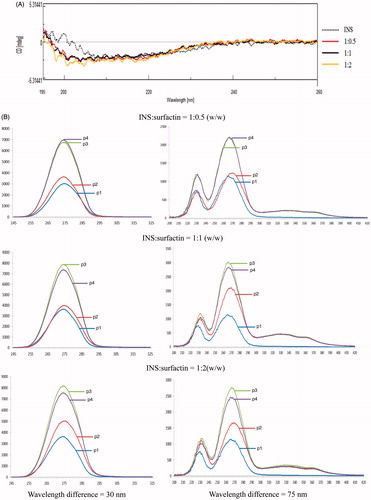
Table 1. INS structure influenced by surfactin.
Figure 4. Surfactin improving INS permeation across intestine epithelial cells. (A) ELISA analysis of INS absorbed by the jejunum in the everted-gut sacs experiment. The Peff value of INS plus surfactin was 4.3 times of that of INS alone. N=6 per group. (B) Intestines of mice orally treated by NHS-Rhodamine B-INS with or without FITC-surfactin. Diabetic mice were orally treated with NHS-Rhodamine B-INS with or without FITC-surfactin, then the intestines of mice were sectioned and observed by CLSM (100 ×). INS with red fluorescence (directed by solid arrow) is co-located with surfactin (green fluorescence, directed by dashed arrow) in the intestinal villi of mice orally treated with NHS-Rhodamine B-INS plus FITC-surfactin (directed by gray arrow), while not in the intestinal villi of mice orally administered with NHS-Rhodamine B-INS alone.
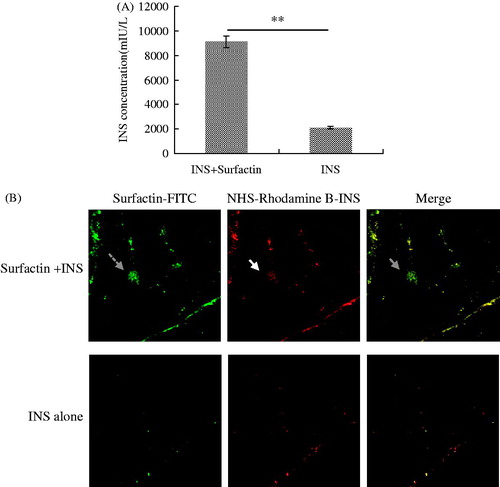
Figure 5. Oral hypoglycemic effects of INS plus surfactin in diabetic mice. (A) Mice orally treated with INS (180 IU/kg) plus different doses of surfactin (100, 500 and 1000 μg per mouse, respectively). (B) Mice orally treated with different doses of INS (180, 90 or 45 IU/kg) plus surfactin (100 μg/mouse). (C) Serum INS levels over time after oral INS (90 IU/kg) plus surfactin (100 μg/mouse) in diabetic mice. (D) OGGT for orla INS (90 IU/kg) plus surfactin (100 μg/mouse). Reported results are means ± SEM of 6 (A & B) or 12 (C & D) mice.
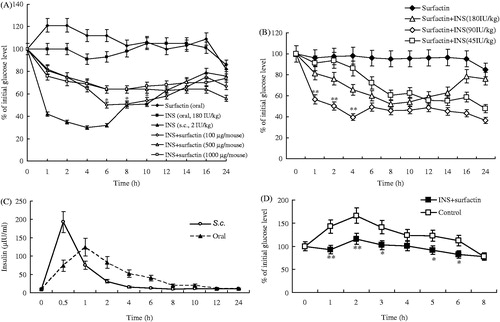
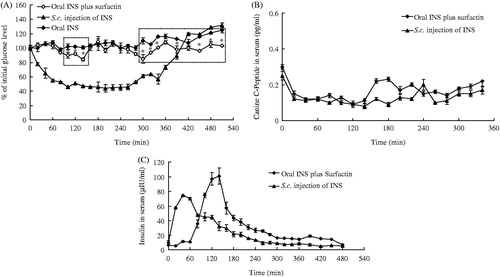
Figure 6. Oral hypoglycemic effects of INS plus surfactin in non-diabetic dogs. (A) Reduction of blood glucose concentrations. Two periods (directed by dashed rectangles) with significant hypoglycemic effects for oral INS plus surfactin when compared to the control. (B) Serum C-peptide concentrations in dogs. (C) Serum INS levels in dogs. The peak INS concentration of oral INS plus surfactin occurred at the 140 min timepoint as 101.842 μIU/ml. Reported results are means ± SEM of three dogs.