
Figures & data
Table 1. Trails of SLN optimization and their evaluation (% entrapment efficiency, % drug content, mean particle size, Zeta potential, and particle distribution index, PDI).
Figure 1. (A) Preferential adsorption of bovine serum albumin with different lipids. Lipids from various sources and chemical compositions were taken for the study and evaluated comparatively. (B) X-ray powder diffractograms of single and binary mixtures of lipids. In the binary mixtures, 1:1 ratio of lipids was used. Patterns of all the spectra were found to be overlapping.
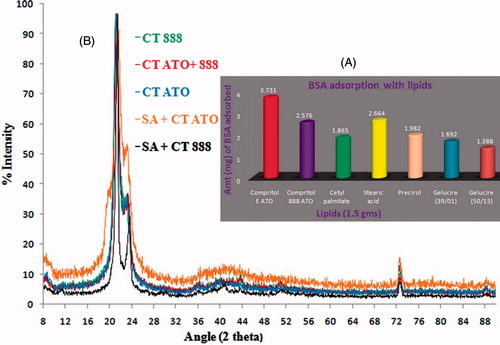
Table 2. X-ray diffractogram interpretation of lipids and their physical mixtures (1:1 ratio).
Figure 2. Transmittance studies of nanosuspension using different stabilizer(s). After the first reading, the nanosuspensions were left undisturbed for 3 d to evaluate stability.
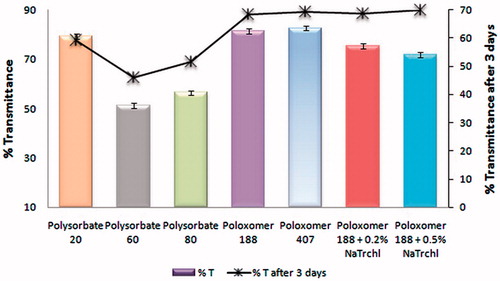
Figure 3. Overlay of differential scanning thermograms (heat flow as a function of temperature) of itraconazole, Single lipids (stearic acid and compritol) and binary lipids. In all the samples, the processes were found to be endothermic in nature. Melting temperatures of all the lipid(s) were not too separated.
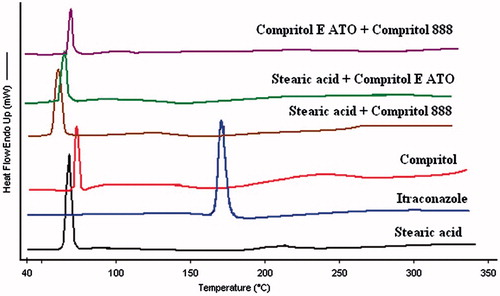
Figure 4. Overlay of differential scanning thermograms (heat flow as a function of temperature) of different solid lipid nanoparticles. In all the samples, the processes were found to be endothermic in nature and there were not any sharp peak rather broad humps were there. Also the melting temperatures of all the SLNs were not too separated.
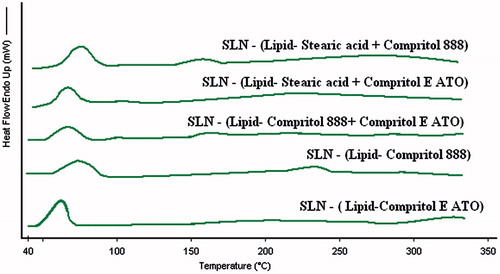
Table 3. Results of the DSC thermograms of single lipid, binary mixtures, and their SLNs.
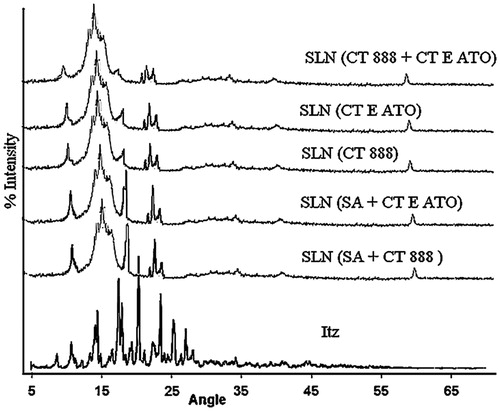
Figure 5. Overlay of X-ray diffractograms of itraconazole and different SLNs. The angles were kept wide. The patterns clearly indicate the change in crystallinity patterns.