Figures & data
Figure 1. Particle size distribution of ACE-loaded: (A) EMVs and (B) ethosomal suspension.
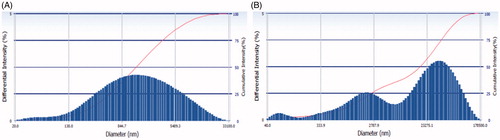
Figure 2. Optical photomicrographs (100 × magnification) of ACE-loaded: (A) EMVs and (B) ethosomal suspension.
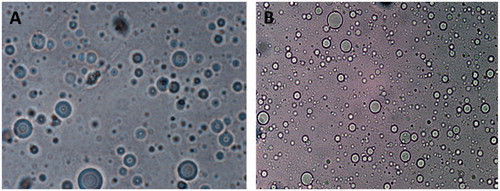
Figure 3. TEM photomicrograph of ACE-loaded: (A) EMVs and (B) ethosomal suspension.
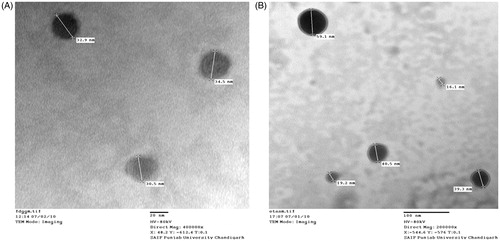
Table 1. Number of vesicles, percent transmittance and drug entrapment of ACE-loaded EMVs and ethosomes.
Figure 4. Percutaneous permeation profile of the selected formulations and other reference products. Each cross bar indicates average value ± SD (n = 3).
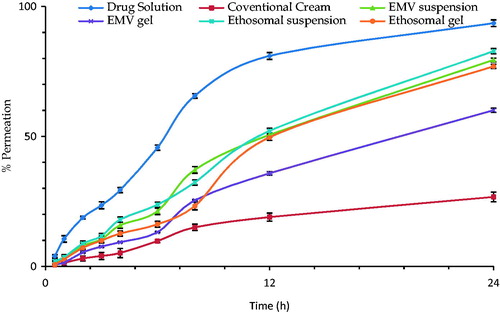
Figure 5. Bar diagram showing the mean percent drug retention in skin from various formulations. Each cross bar indicates average value ± SD (n = 3).
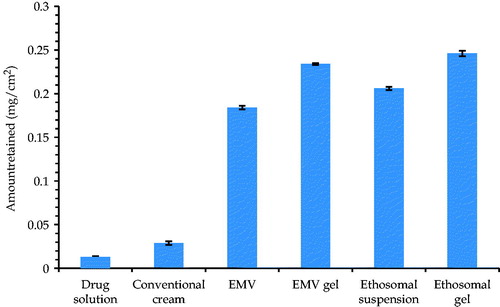
Figure 6. Photomicrographs of skin sections treated with (A) saline (control), (B) conventional cream, (C) EMV gel, and (D) ethosomal gel.
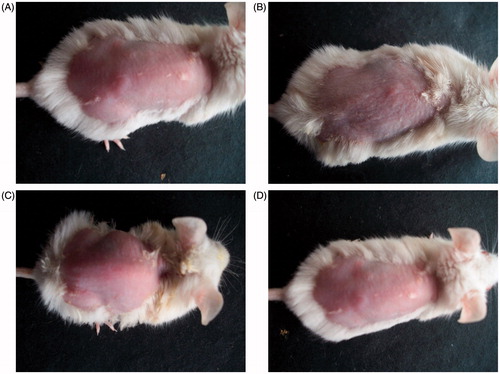
Figure 7. Histopathology of skin sections treated with (A) conventional cream, (B) EMV gel, and (C) ethosomal gel.
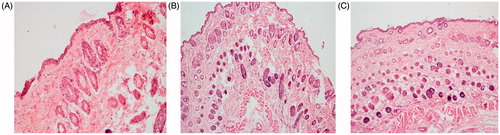
Figure 8. Bar diagram depicting percent analgesic effect of the various formulations. Each cross bar indicates average value ± SD (n = 3).
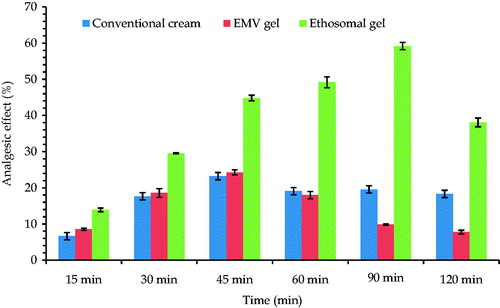
Figure 9. Comparative percent inhibition of paw edema of various formulations. Each cross bar indicates average value ± SD (n = 3).
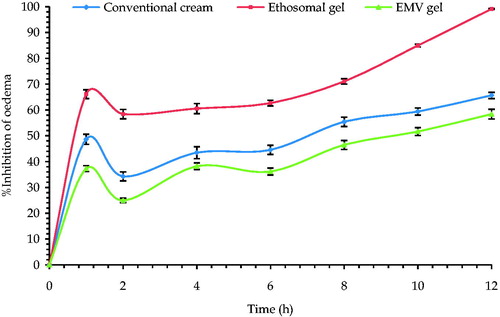
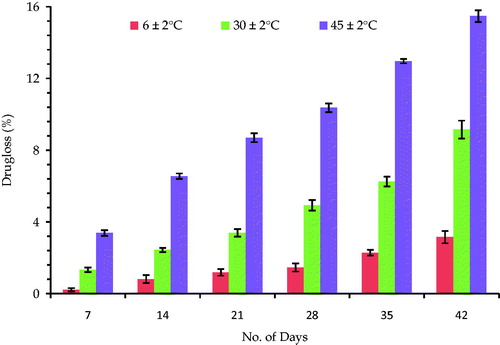
Figure 10. Bar diagram depicting the stability of ACE-loaded EMVs at different temperatures. Each cross bar indicates average value ± SD (n = 3).
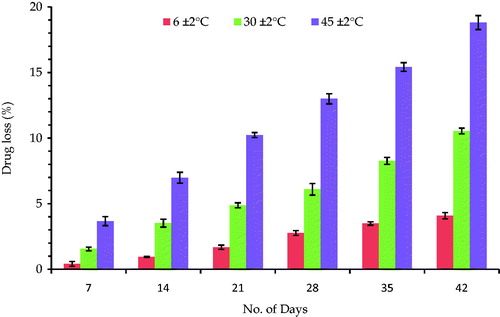
Figure 11. Bar diagram depicting the stability of ACE-loaded ethosomes at different temperatures. Each cross bar indicates average value ± SD (n = 3).