Figures & data
Figure 1. Amounts of initial insulin and insulin interacted with C-Tat-resin or Tat-C-resin or 2-mercaptoethanol-resin.
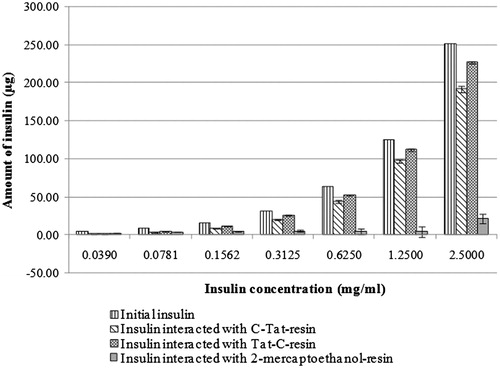
Table 1. Physical characteristics of elastic, non-elastic neutral and anionic niosomes loaded and not loaded with the peptides (insulin, Tat or the insulin–Tat mixture).
Figure 2. Gel electrophoresis of niosomes loaded and not loaded with human insulin-Tat mixture (1:3 molar ratio). Lane 1 = the standard human insulin. Lane 2 = human insulin-Tat mixture (1:3 molar ratio). Lane 3 = blank non-elastic neutral niosomes. Lane 4 = non-elastic neutral niosomes loaded with the mixture. Lane 5 = blank elastic neutral niosomes. Lane 6 = elastic neutral niosomes loaded with the mixture. Lane 7 = blank non-elastic anionic niosomes. Lane 8 = non-elastic anionic niosomes loaded with the mixture. Lane 9 = blank elastic anionic niosomes. Lane 10 = elastic anionic niosomes loaded with the mixture.
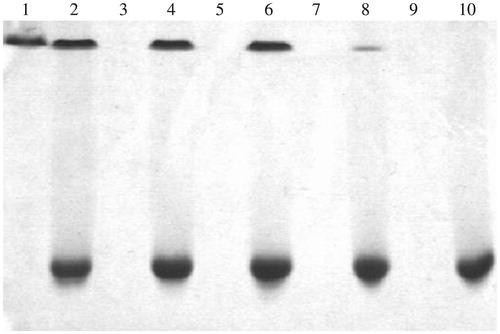
Table 2. Entrapment efficiency of the peptides (insulin, Tat or the insulin–Tat mixture) in elastic, non-elastic neutral and anionic niosomes.
Figure 3. The percentages of insulin released from the elastic anionic niosomes after incubated at 37 °C for 6 h.
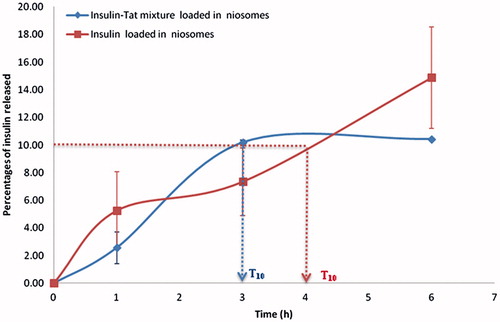
Table 3. Physical stability of elastic anionic niosomes loaded with human insulin–Tat mixture (1:3 molar ratio) or free insulin when stored at 5 ± 3 °C, room temperature (30 ± 2 °C) and 40 ± 2 °C for 4 weeks.
Figure 4. Percentages remaining of insulin in the insulin-Tat mixture (1:3 molar ratio) loaded and not loaded in elastic anionic niosomes when stored at 5 ± 3 °C, room temperature (30 ± 2 °C) and 40 ± 2 °C for 12 weeks.
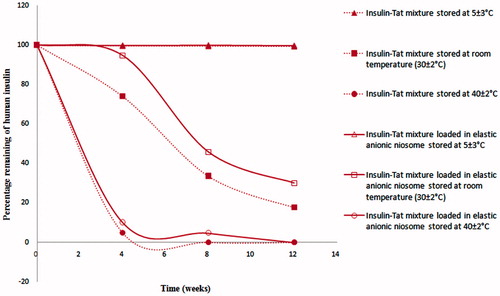
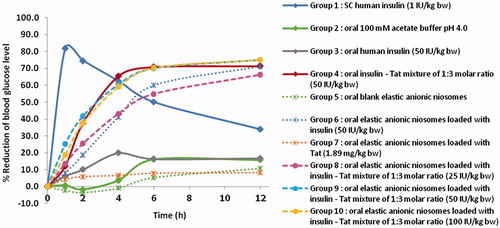
Figure 5. The blood glucose reduction percentages in alloxan-induced diabetic mice (n = 5–6) at various time intervals after treated with various insulin systems. SC, Subcutaneous injection.