Figures & data
Table 1. The response values for the different levels of experimental design.
Table 2. Minimal gelator concentration of MDP in different solvent at 25 °C.
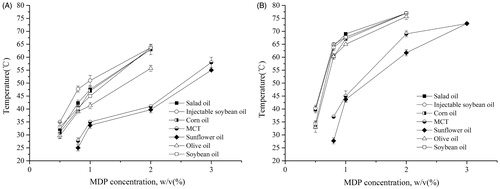
Figure 1. Phase transition temperature of the organogel based on MDP. (A) Temperature of sol to gel (Tsg) and (B) temperature of gel to sol (Tgs).
Scheme 1. The synthetic scheme of methyl (S)-2,5-ditetradecanamidopentanoate.
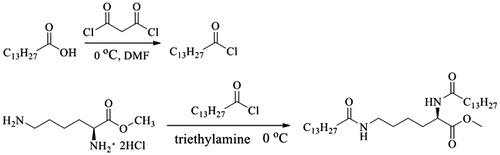
Figure 2. SEM images of xerogels formed by MDP in toluene at the concentration of 10% (A) and 15% (B).
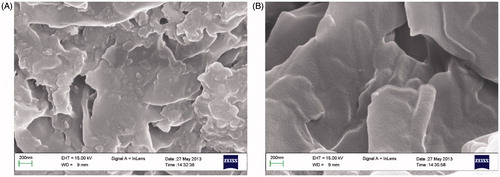
Figure 3. DSC thermograms of the drug (A) and organogel (B) with (a), (d) CC organogel and (b), (c) blank organogel.
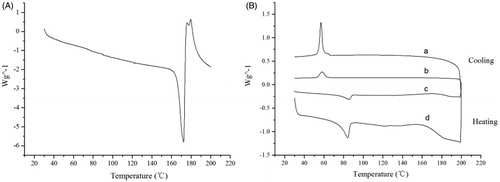
Figure 4. Variation of storage modulus (G′) and loss modulus (G″) of blank organogel (A) and CC organogel (B).
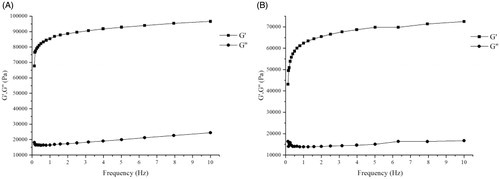
Figure 5. Calibration curve of electrical conductivity with NMP in PBS.
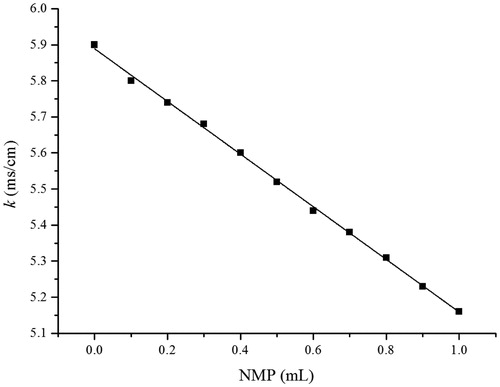
Figure 6. Electrical conductivity curves of organogel without NMP (▪) and organogel contained NMP (•).
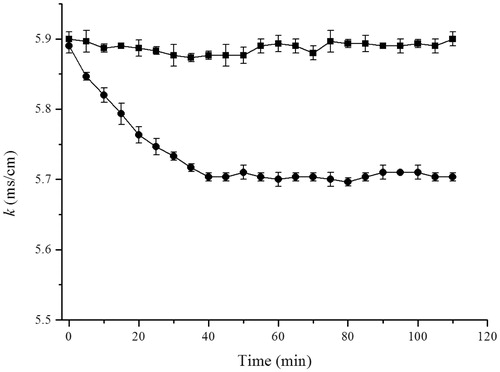
Figure 7. In vitro release profiles of oil solution (•) and organogel formulation (▪).
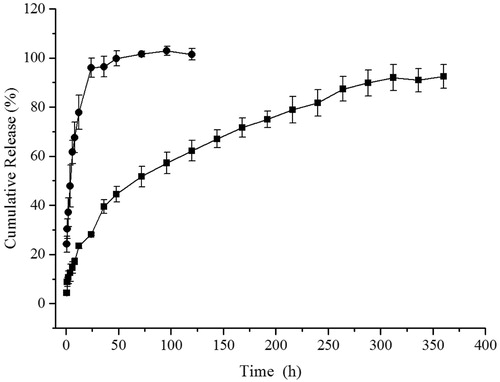
Figure 8. In vivo plasma concentration–time curves of drug oily solution (▪) and organogel formulation (•).
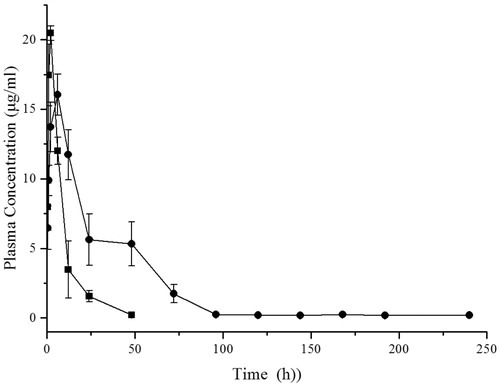
Table 3. Pharmacokinetic parameters obtained after subcutaneous injection of oily solution and organogel formulation in rats (mean ± SD; n = 5).
Figure 9. In vivo cumulative release-time curve of CC organogel formulation.
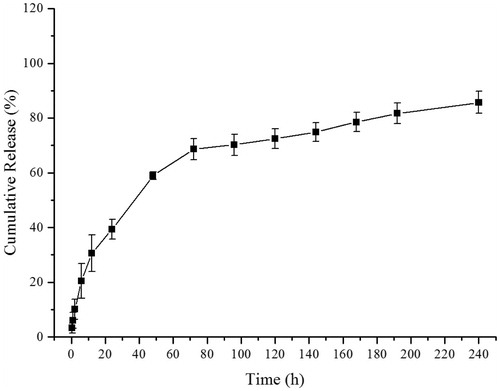
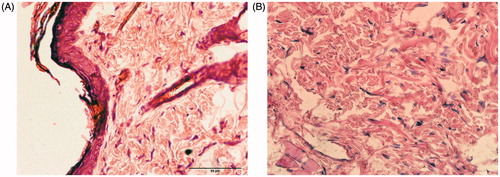
Figure 10. Histological evaluation of blank group (A) and adjacent tissues injected with the formulation after 10 d (B). Original magnification: 400×.