Figures & data
Table 1. Solubility of drug in various lipids and surfactants.
Figure 1. Phase behavior of microemulsion formed from Captex 355 with Cremophor RH40: Transcutol HP and water varying Cremophor RH40: Transcutol HP ratio, i.e., (a) 1:0 (b) 3:1 (c) 2:1 (d) 1:1; (CR RH40 – Cremophor RH40; THP – Transcutol HP).
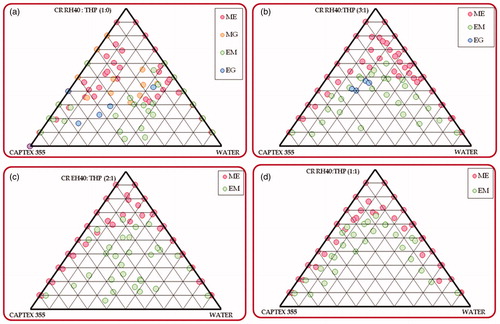
Figure 2. Phase behavior of microemulsion formed from ethyl oleate with Tween 80: Transcutol HP and water varying Tween 80: Transcutol HP ratio as (a) 1:0; (b) 2:1; (c) 3:1 (T80 – Tween 80; THP – Transcutol HP).
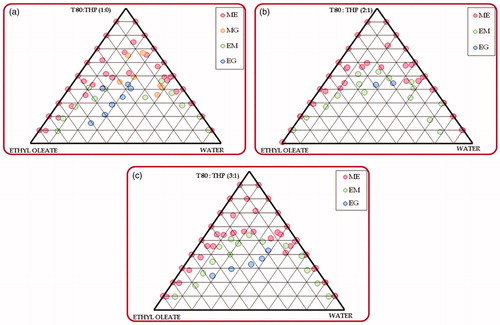
Table 2. Physical and dissolution parameters for all seventeen MCT-SNEDDS formulations prepared as per the BBD.
Table 3. Physical and dissolution parameters for all seventeen LCT-SNEDDS formulations prepared as per the BBD[TQ2].
Figure 3. Plot representing percent drug released from optimized formulations (MCT and LCT SNEDDS) and pure drug. The inset shows the percent drug release in 30 min (n = 6).
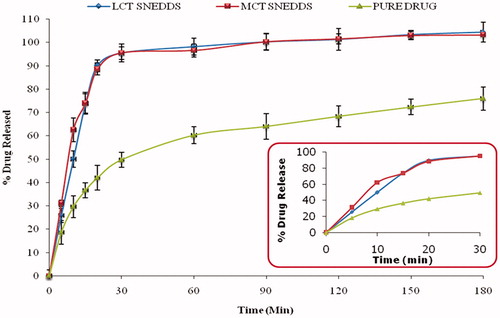
Figure 4. Plot showing the comparative improvement in the values of permeability (effective permeability and wall permeability) and absorption parameters (absorption number and Fraction dose absorbed) from the optimized MCT and LCT-SNEDDS as compared to the pure drug.
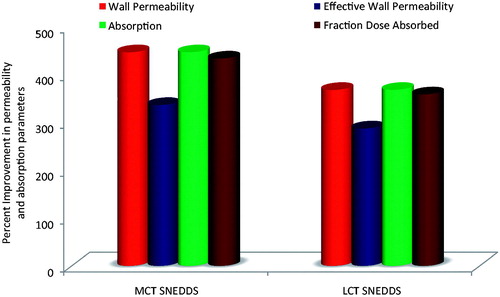
Figure 5. Percent suppression in various diagnostic parameters observed with different treatment formulations with respect to pure drug at 20th day (OPT M: optimized MCT-SNEDDS; OPT L: optimized LCT-SNEDDS).
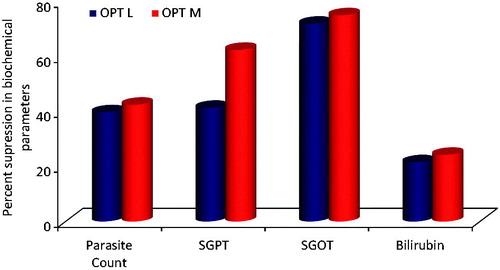
Table 4. Mean percent parasitemia from day “0” to day “20”.
Figure 6. Kaplan–Meier curves for percent survival of different animal groups indicating significantly lower (p < 0.001) mortality for OPT L and OPT M viz-à-viz pure drug. (OPT M: optimized MCT-SNEDDS; OPT L: optimized LCT-SNEDDS).
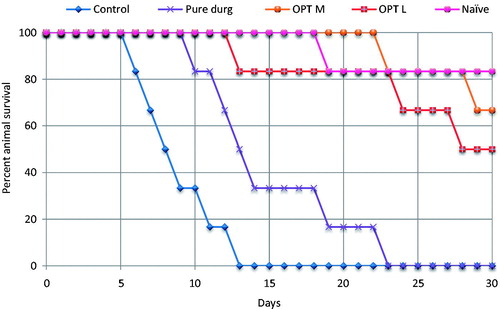
Table 5. Values of liver function parameter, namely SGPT observed during study.
Table 6. Values of liver function parameter, namely SGOT observed during study.
Table 7. Values of liver function parameter, namely total bilirubin observed during study.
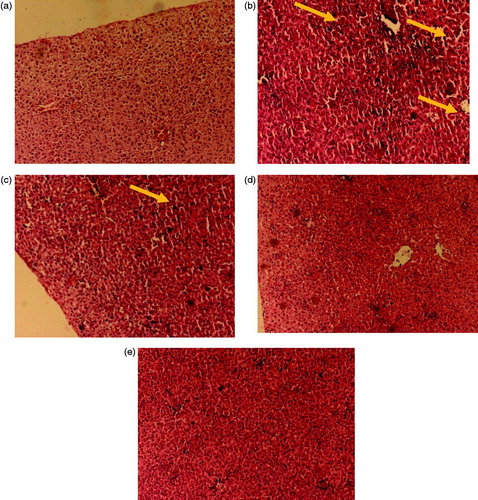
Figure 7. Histopathological images of rat liver segments, (a) indicating intact liver haepatocytes without any necrosis, naïve group; (b) indicating areas of centrilobular necrosis and congestion of centrilobular veins by parasitized erythrocytes (indicated by arrows), negative control; (c) necrotic areas lesser in extent, fewer centrilobular vein congestion, pure drug treated group; (d) and (e) no significant signs of haepatocytic cell necrosis or phagocytic cell hypertrophy, optimized MCT and LCT-SNEDDS treated group.