Figures & data
Figure 1. (A) Chemical structure of icariside II. (B). Chemical structure of Solutol®HS15. (C). Chemical structure of Pluronics F127.
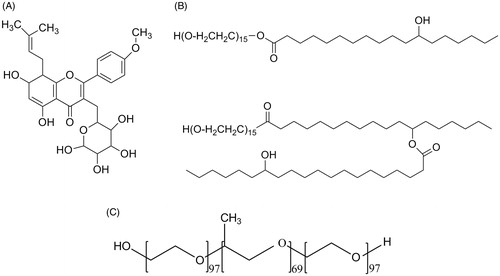
Figure 2. (A) Size distribution of SF mixed micelles as determined by DLS. (B) TEM images of SF-IS mixed micelles.
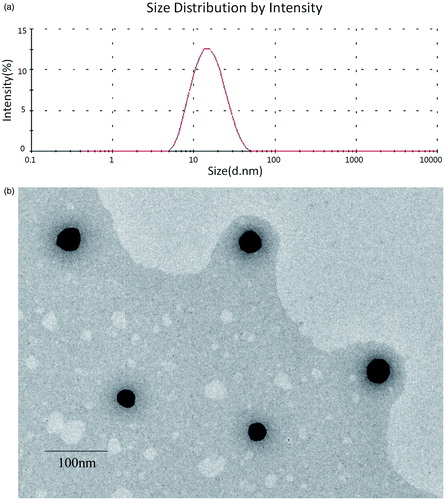
Table 1. HS15/F127 ratio and characteristics of SF mixed micelles.
Figure 3. In vitro release profiles of the micelles in the simulated intestinal medium, pH 6.8.
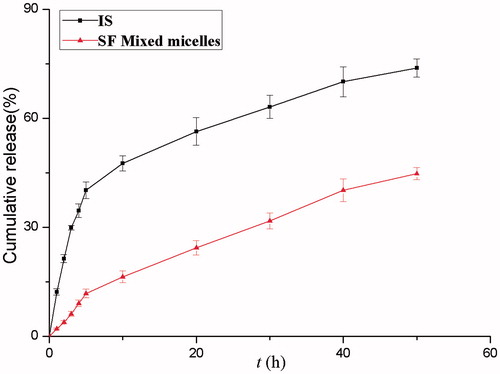
Figure 4. (A) IS. (B) SF (4:1) mixed micelles. Effects of micelles in permeability of IS (20 μM). Absorptive permeability is expressed as Papp (AP-BL) and secretory permeability is expressed as Papp (BL-AP). Date are presented as mean ± SD (n = 3). The asterisk symbol indicates a statistically significant difference. The number of asterisk symbol indicates the level of significance with **p < 0.01. One-way ANOVA with Tamhane’s post hoc was used to analyze the data statistically.
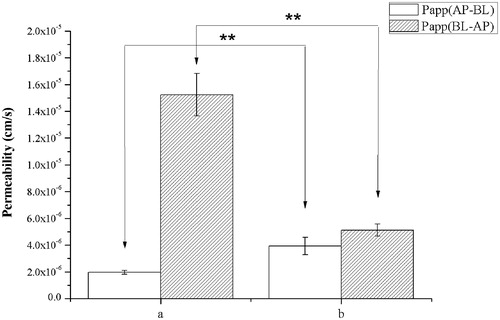
Table 2. Permeability and efflux ratio.
Figure 5. The plasma concentration-time curve of IS in rats after oral administration of IS, SF mixed micelles (100 mg/kg, IS). Data are presented as mean ± SD (n = 6).
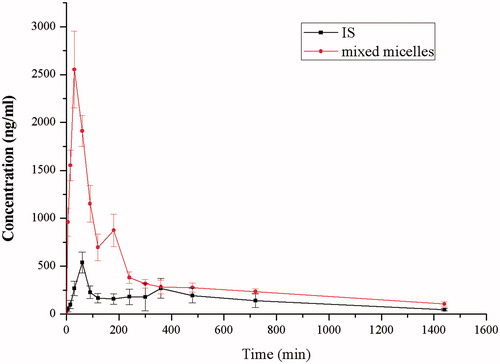
Table 3. Pharmacokinetic parameters of IS, SF mixed micelles (100 mg/kg, IS).
Figure 6. Gastrointestinal safety assay observed by HE staining. (A) APIs used in this study; (B) SF-IS mixed micelles used in this study (1–5) stomach and intestinal (duodenum, jejunum, ileum, colon).
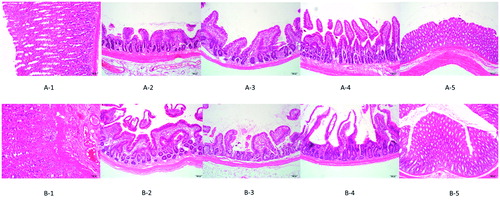
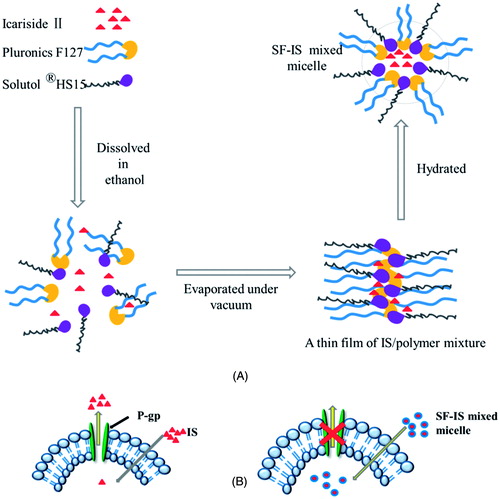
Figure 7. (A) Schematic illustration of forming progress of SF-IS mixed micelles. (B) Schematic illustration of SF-IS mixed micelles inhibit the efflux system.