311
Views
7
CrossRef citations to date
0
Altmetric
Research Article

Magnetic Resonance Spectroscopy for Evaluation of Liposome-Encapsulated Hemoglobin as a Resuscitation Fluid

, , &
Pages 69-78 | Published online: 03 Mar 2010

Figures & data

Figure 1. Scheme for the synthesis of anionic non-phospholipid CHHDA. The final compound was obtained with 76% yield.
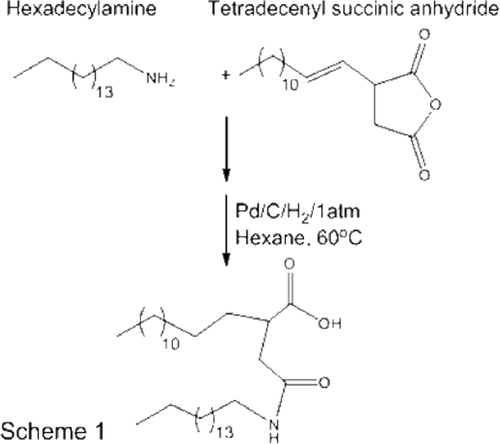
Figure 1. Scheme for the synthesis of anionic non-phospholipid CHHDA. The final compound was obtained with 76% yield.

Figure 2. Schematic flow chart of MRS experiment. The rats remained under isoflurane anesthesia during spectroscopy, but were allowed to recover during indicated periods. The isovolemically resuscitated rats received either saline or LEH administrations at 0.5 ml/min.
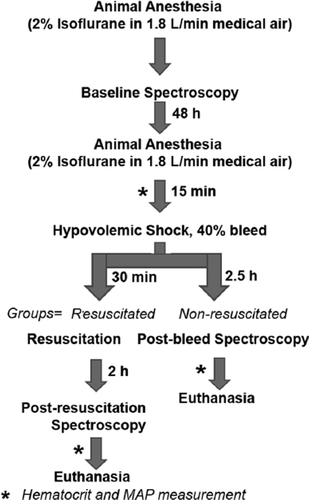
Figure 2. Schematic flow chart of MRS experiment. The rats remained under isoflurane anesthesia during spectroscopy, but were allowed to recover during indicated periods. The isovolemically resuscitated rats received either saline or LEH administrations at 0.5 ml/min.

Table 1. Properties of LEH.

Figure 3. Changes in mean arterial pressure in rats subjected to 40% hemorrhage followed 30 min later by resuscitation with either LEH or saline at 0.5 ml/min.
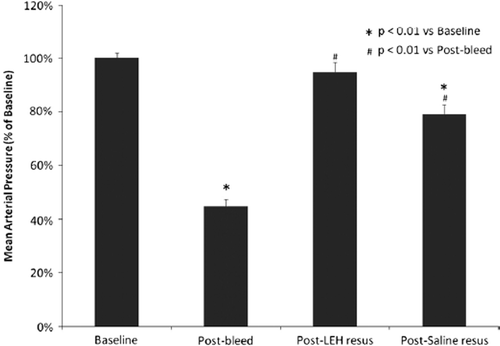
Figure 3. Changes in mean arterial pressure in rats subjected to 40% hemorrhage followed 30 min later by resuscitation with either LEH or saline at 0.5 ml/min.

Figure 4. Both 1H and 31P spectra were acquired at the same location, encompassing part of the cortex and corpus striatum (voxel shown as square).

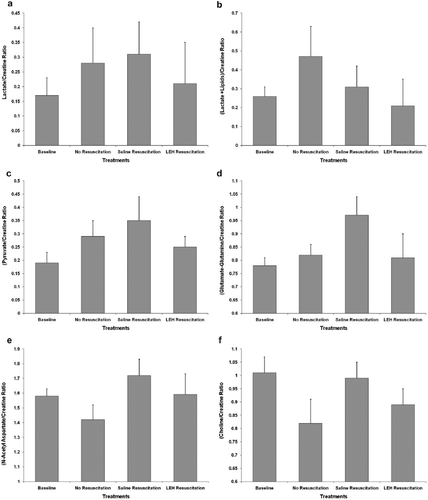
Figure 4. Both 1H and 31P spectra were acquired at the same location, encompassing part of the cortex and corpus striatum (voxel shown as square).
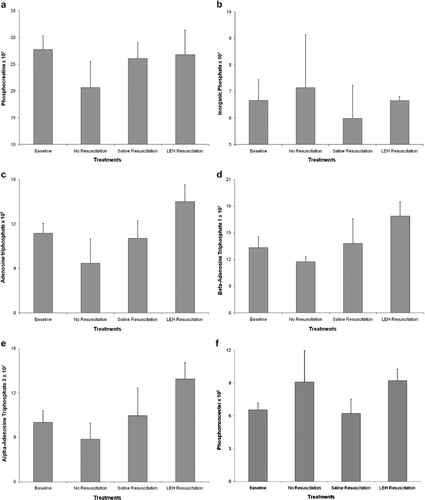
Figure 5. The ratios of various metabolites with respect to creatine obtained from 1H spectroscopy: (a) lactate; (b) lactate plus lipid; (c) pyruvate; (d) glutamate-glutamine; (e) N-Acetyl aspartate; and (f) choline.

Figure 5. The ratios of various metabolites with respect to creatine obtained from 1H spectroscopy: (a) lactate; (b) lactate plus lipid; (c) pyruvate; (d) glutamate-glutamine; (e) N-Acetyl aspartate; and (f) choline.

Figure 6. Values of various phosphorus metabolites obtained from 31P spectroscopy: (a) phosphocreatine; (b) inorganic phosphate; (c) total ATP; (d) β-ATP; (e) α-ATP; and (f) phosphomonoesters.

Figure 6. Values of various phosphorus metabolites obtained from 31P spectroscopy: (a) phosphocreatine; (b) inorganic phosphate; (c) total ATP; (d) β-ATP; (e) α-ATP; and (f) phosphomonoesters.

Reprints and Corporate Permissions

Please note: Selecting permissions does not provide access to the full text of the article, please see our help page How do I view content?

To request a reprint or corporate permissions for this article, please click on the relevant link below:

Academic Permissions

Please note: Selecting permissions does not provide access to the full text of the article, please see our help page How do I view content?

Obtain permissions instantly via Rightslink by clicking on the button below:

If you are unable to obtain permissions via Rightslink, please complete and submit this Permissions form. For more information, please visit our Permissions help page.