409
Views
10
CrossRef citations to date
0
Altmetric
Research Article

Early Spatiotemporal Progress of Myelinated Nerve Fiber Regenerating through Biological Chitin Conduit after Injury

, , , , &
Pages 103-108 | Published online: 08 Mar 2010

Figures & data

Figure 1. Animal model: chitin conduit bridging SD rat sciatic nerve injury with a small gap (2 mm).

Figure 1. Animal model: chitin conduit bridging SD rat sciatic nerve injury with a small gap (2 mm).

Figure 2. Histological examination methods and sites.

Figure 2. Histological examination methods and sites.

Figure 3. Histological examination on day 1 after surgery. Masson and immunofluorescence staining show no significant changes of the nerve structure; the distance between the two stumps was about 2 mm (scale range is 4 mm, n=3).
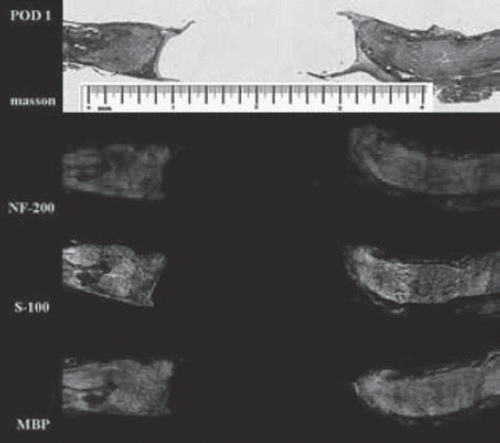
Figure 3. Histological examination on day 1 after surgery. Masson and immunofluorescence staining show no significant changes of the nerve structure; the distance between the two stumps was about 2 mm (scale range is 4 mm, n=3).

Figure 4. Histological examination on day 7 after surgery. The distal segment of nerve fibers is almost completely degenerated 7 days after surgery; the yellow arrow shows original site of proximal nerve fibers (scale range is 4 mm, n=3).
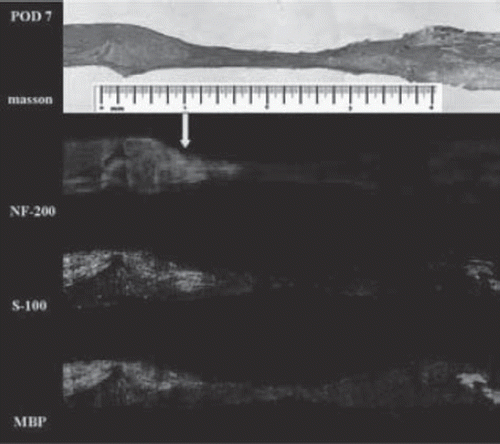
Figure 4. Histological examination on day 7 after surgery. The distal segment of nerve fibers is almost completely degenerated 7 days after surgery; the yellow arrow shows original site of proximal nerve fibers (scale range is 4 mm, n=3).

Figure 5. Histological examination on day 21 after surgery. The proximal axon advanced into the conduit and Schwann cells migrate into the lumen from both sides of the conduit (scale range is 4 mm, n=3).
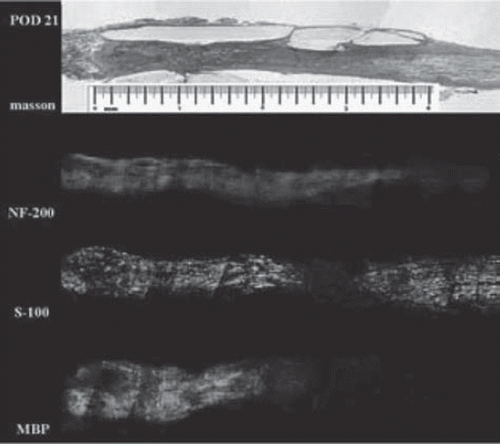
Figure 5. Histological examination on day 21 after surgery. The proximal axon advanced into the conduit and Schwann cells migrate into the lumen from both sides of the conduit (scale range is 4 mm, n=3).

Figure 6. Histological examination on day 28 after surgery. Myelin reached the outlet of the conduit on this day (scale range is 4 mm, n=3).
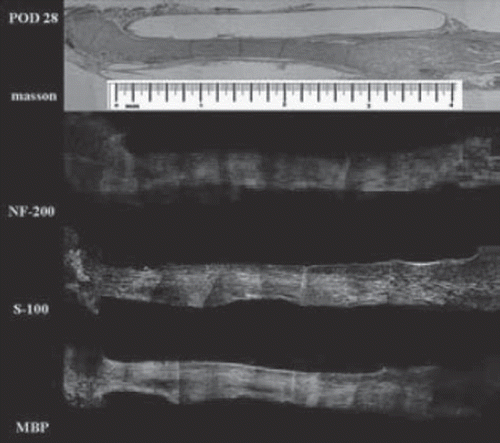
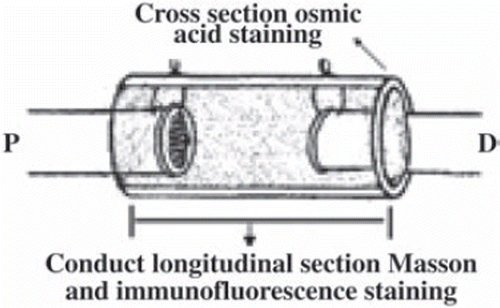
Figure 6. Histological examination on day 28 after surgery. Myelin reached the outlet of the conduit on this day (scale range is 4 mm, n=3).
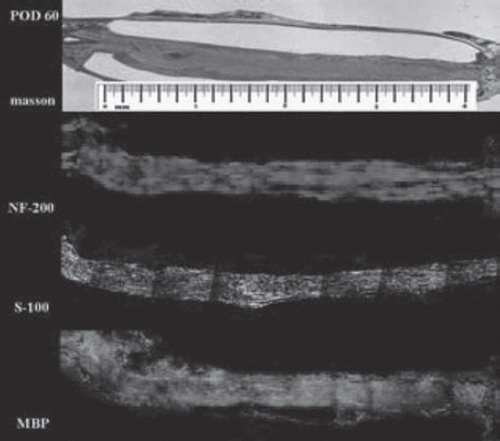
Figure 7. Histological examination on day 60 after surgery. Nerve fibers manifest a more mature morphology (scale range is 4 mm, n=3).

Figure 7. Histological examination on day 60 after surgery. Nerve fibers manifest a more mature morphology (scale range is 4 mm, n=3).

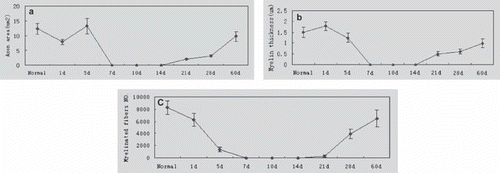
Figure 8. Quantitative changes of the myelin sheath and axons in cross section at the outlet of the conduit axon. Area of myelinated axons (a), thickness of myelin sheath (b), and the number of myelinated axons (c) changed during degeneration and regeneration after surgery (n=5).

Figure 8. Quantitative changes of the myelin sheath and axons in cross section at the outlet of the conduit axon. Area of myelinated axons (a), thickness of myelin sheath (b), and the number of myelinated axons (c) changed during degeneration and regeneration after surgery (n=5).

Reprints and Corporate Permissions

Please note: Selecting permissions does not provide access to the full text of the article, please see our help page How do I view content?

To request a reprint or corporate permissions for this article, please click on the relevant link below:

Academic Permissions

Please note: Selecting permissions does not provide access to the full text of the article, please see our help page How do I view content?

Obtain permissions instantly via Rightslink by clicking on the button below:

If you are unable to obtain permissions via Rightslink, please complete and submit this Permissions form. For more information, please visit our Permissions help page.