Figures & data
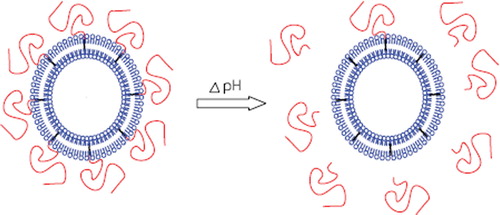
Scheme 1. pH-sensitive liposomes following the change of pH value.
Scheme 2. The structure of mPEG-Hz-Chol.
Table 1. Stability of plain liposomes and pH-sensitive liposomes with change of particle sizes with different media at 37°C for 1 h, 12 h, 24h
Figure 1. Plasma concentration profiles of PTX after intravenous administration in rats. Taxol®(PTX-INJ ▀), PTX in plain liposome (PTX-PL •) and modified liposome (PTX-ML ▴). (mean±S.D., n = 5)
Table 2. The main pharmacokinetics parameters after intravenous administration of injection, PL and ML to rats (mean±S.D. n=5)
Table 3. AUC (0-tn) ((mg/ml)*h or (mg/g)*h) of PTX in blood and tissues (n=6)
Table 4. MRT (0-tn) (h) of PTX in blood and tissues (n = 6)
Table 5. In vivo antitumor effect of Taxol ®, plain liposomes and pH-sensitive liposomes in tumor bearing mice model
Figure 2. The PTX concentration of three groups (Taxol, PTX-PL and PTX-ML) in tissues at different time points (0.25, 0.5, 1, 2, 4, 6, 8, 12, 24 h) (mean±S.D., n = 6).
Figure 3. Change of body weight after injection in BALB/c mice inoculated with Heps cancer cells. Taxol® (•), plain liposome (▴) and pH-sensitive liposome (▾) was intravenously injected (20 mg/kg). Normal saline (▀) was injected as a control. The zero point of X-axis indicates the first day of PTX injection. Each data represents the mean±standard deviation (n = 5).
Figure 4. The effect of PTX on the inhibition of tumor growth in BALB/c mice inoculated with Heps cancer cells. Taxol® (•), plain liposome (▴) and pH-sensitive liposome (▾) was intravenously injected (20 mg/kg). Normal saline (▀) was injected as a control. The zero point of X-axis indicates the first day of PTX injection. Each data represents the mean±standard deviation (n = 5).
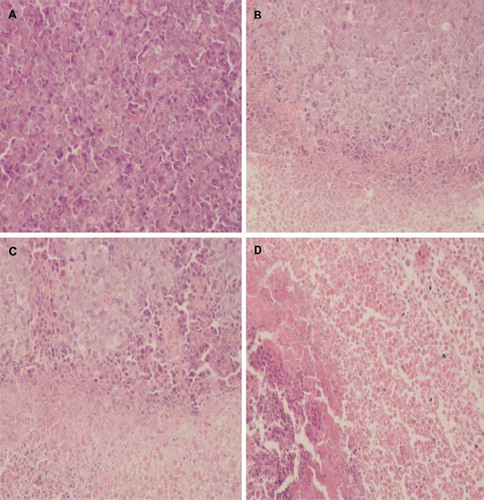
Figure 5. Pathology section of tumor with different PTX formulation. Normal saline as a control (A), Taxol® (B), plain liposome (C) and pH-sensitive liposome (D). (hematoxylin and eosin,original magnification ×200).