Figures & data
Figure 1. Representations of different artificial bones in reality: (a) powder of nano-HA artificial bone; (b) Nano-HA artificial bone; (c) normal HA artificial bone; (d) X-ray diffraction spectrum: a-human bone, b-nano-HA artificial bone.
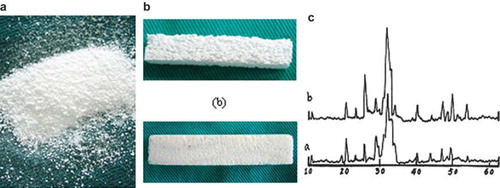
Figure 2. Structure of specimen under invert microscope: (a) Nano-HA artificial bone; (b) Normal HA artificial bone. (×400).
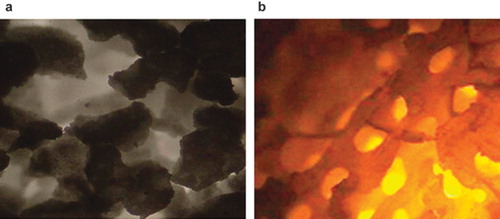
Figure 3. X-ray photograph for the bone defect of group A: (a) at 4th week, the material has been degraded partly; (b) at 8th week, the interaction surface between new bone tissues and the material was illegible; (c) at 12th week, the material has been degraded completely, and the bone defect has been repaired.
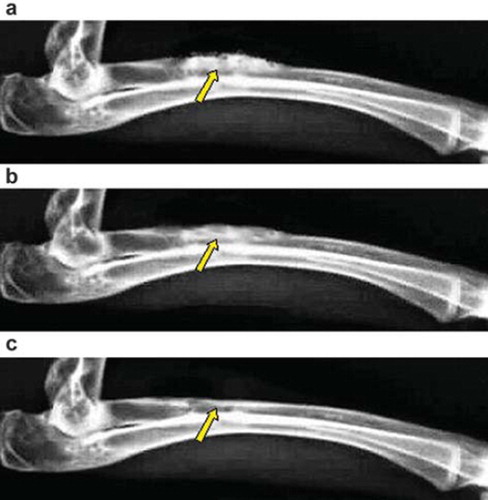
Figure 4. X-ray photograph for the bone defect of group B: (a) at 4th week, the interaction surface between new bone tissues and the material is clear; (b) at 8th week, the interaction surface between new bone tissues and the material is clear; (c) at 12th week, the material has not been degraded completely, and the bone defect has been partly repaired.
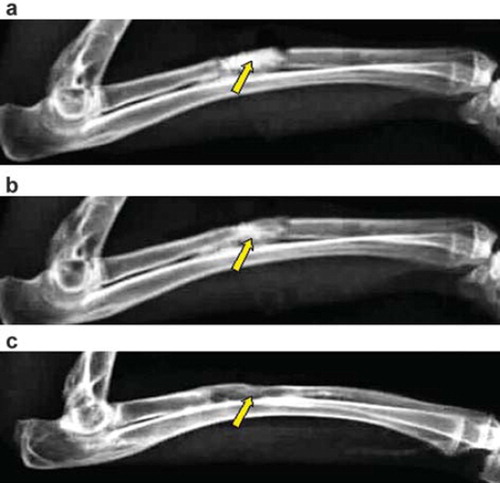
Table 1. Bone formation and Lane-Sandhu X-ray molding score among different groups (Mean±SD)
Figure 5. Radionuclide bone imaging photo of group A: (a) at 4th week; (b) at 8th week; (c) at 12th week, respectively.
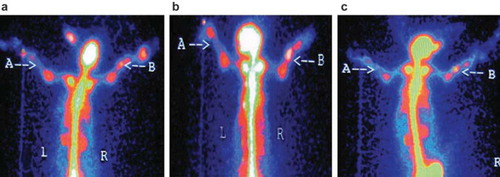
Figure 6. Radionuclide bone imaging photo of group B: (a) at 4th week; (b) at 8th week; (c) at 12th week, respectively.
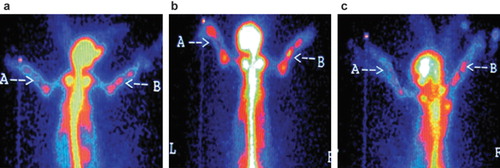
Table 2. Intape ratio of operative site in static phase (S, n=5)
Table 3. Biomechanical test results of three different groups (Mean±SD, n = 4)