Figures & data
Figure 1. Chemical reaction involved in immobilization of uricase on to PANI/MWCNT Composites.
Figure 2. (2a) Scanning electron micrograhs of PANI deposited on ITO coated glass plate (2b) Scanning electron micrograhs of MWCNT/PANI deposited on ITO coated glass plate (2c) Scanning electron micrograhs of MWCNT/PANI/uricase deposited on ITO coated glass plate.
Scheme 1. Schematic diagram of the uric acid biosensor.
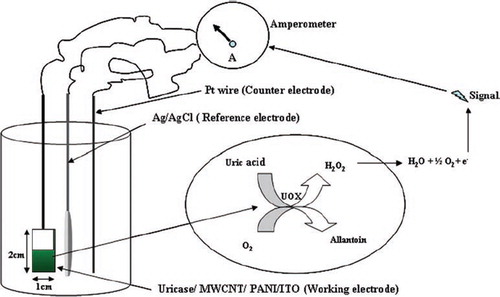
Figure 3. Scheme of electron flow and current generation in uric acid biosensor employing Uricase/MWCNT/PANI/ITO electrode.
Table 1. Effect of various serum substances on response of Uricase biosensor employing Bacillus and Vigna uricase/MWCNT/PANI/ITO electrode
Figure 4. Calibilration curve for uric acid biosensor with uricase/MWCNT/PANI/ITO electrode.
Figure 5. Correlation between serum uric acid values of diseased individuals determined by standard colorimetric method employing free enzyme (x-axis) and the present by biosensor employing Bacillus uricase/MWCNT/PANI/ITO electrode method (y-axis) (n=60), regression equation being y = 0.969x − 0.046.
Table 2. A comparison of present uric acid biosensor with earlier reported amperometric biosensors
Figure 6. Effect of storage at 4°C on the response of biosensor employing uricase/MWCNT/PANI/ITO electrode.