Figures & data
Table 1. Main reagent and equipment
Table 2. Gross grading scale fsor articular cartilage defects
Figure 1. Gross observation of bone marrow MSCs group 12 weeks postoperatively.
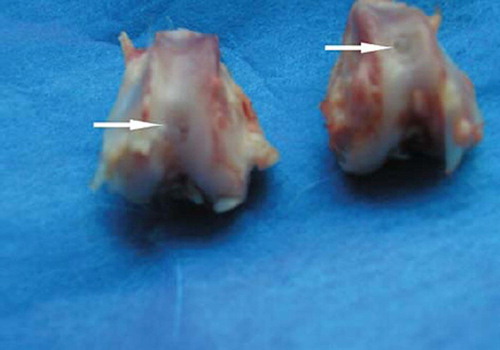
Table 3. Gross scores for articular cartilage defects at 12 weeks ![]() (O'Driscoll's scores, n = 6)
(O'Driscoll's scores, n = 6)
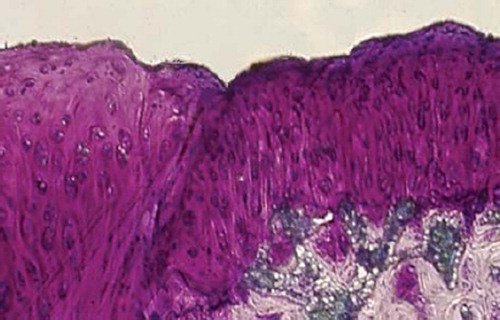
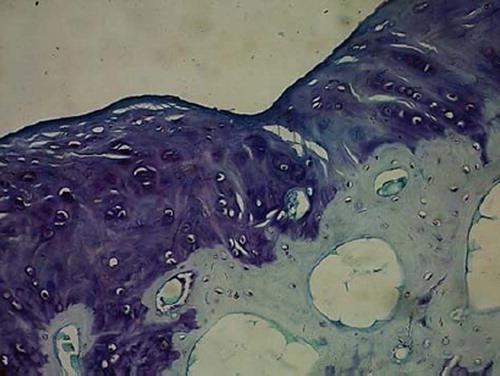
Figures 2. Sagittal sections of cartilage defects transplanted with MSCs derived from bone marrow (1) at 12 weeks (toluidine blue staining × 400).
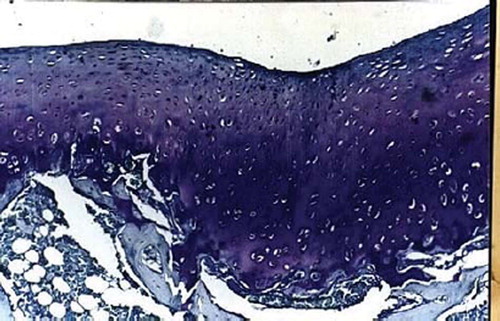
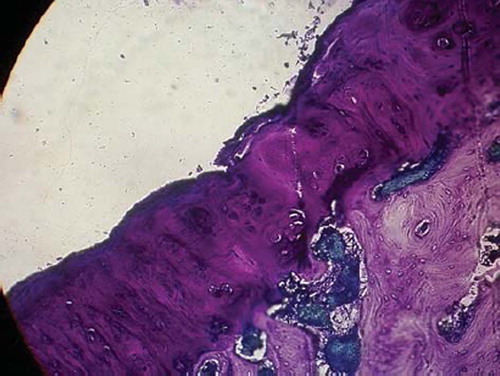
Figures 3. Sagittal sections of cartilage defects transplanted with MSCs derived from periostenum (2) at 12 weeks (toluidine blue staining × 400).
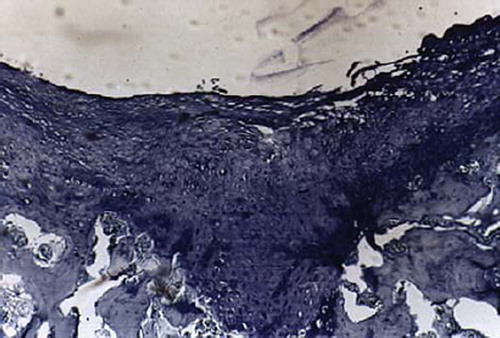
Figures 4. Sagittal sections of cartilage defects transplanted with MSCs derived from syanovium (3) at 12 weeks (toluidine blue staining × 400).
Figures 5. Sagittal sections of cartilage defects transplanted with MSCs derived from adipose (4) at 12 weeks (toluidine blue staining × 400).
Figures 6. Sagittal sections of cartilage defects transplanted with MSCs derived from muscle (5) at 12 weeks (toluidine blue staining × 400).
Figures 7. Sagittal sections of cartilage defects transplanted with MSCs derived from control group (6) at 12 weeks (toluidine blue staining × 400).
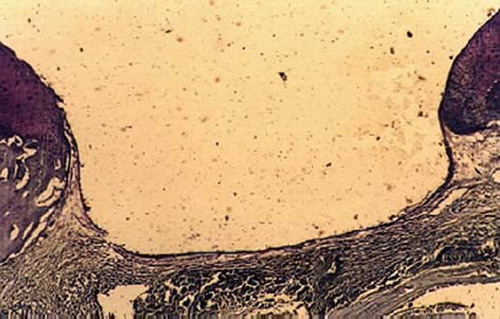
Table 4. Histological scores for articular cartilage defects at 12 weeks (O'Driscoll's scores, ![]() , n = 6)
, n = 6)
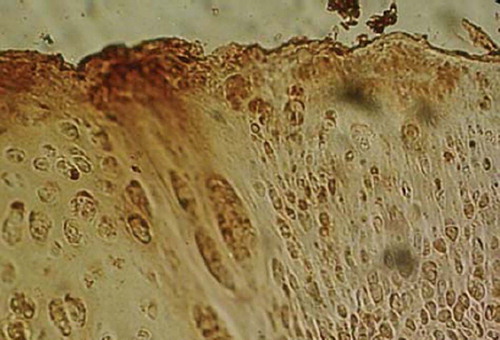
Figure 8. Immunohistochemistry staining of type II collagen observation of bone marrow MSCs group 12 weeks postoperatively (× 1 000).