Figures & data
Table 1. Arterial pH and blood gases during and after 2 h of middle cerebral artery occlusion (MCAO) in groups with no transfusion or transfusion at 20 min of MCAO (mean ± SE; n = 10)
Table 2. Arterial blood electrolytes during and after 2 h of MCAO in groups with no transfusion or transfusion at 20 min of MCAO (mean ± SE; n = 10)
Table 3. Whole blood hemoglobin analysis during and after 2 h of MCAO in groups with no transfusion or transfusion at 20 min of MCAO (mean ± SE; n = 10)
Figure 1. Mean arterial blood pressure (A) and laser-Doppler flux, measured over lateral parietal cortex and expressed as a percent of baseline (B), during 2 h of middle cerebral artery occlusion (MCAO) and the first 30 min of reperfusion in groups of rats undergoing either no transfusion or transfusion with 10 ml/kg of PEG-albumin or PEG-COHb at 20 min of MCAO (mean ± SE; n = 10 per group).
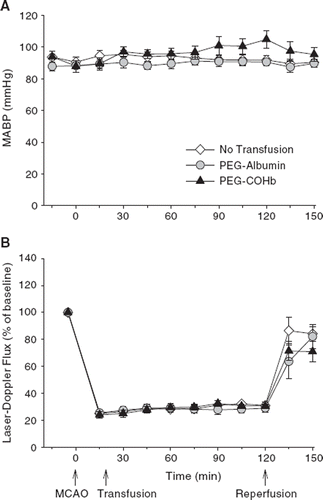
Table 4. Rectal temperature during and after 2 h of MCAO in groups with no transfusion or transfusion at 20 min of MCAO (mean ± SE; n = 10)
Figure 2. Neurologic deficit score on a 0–4 scale (0 = no deficit) at 1 or 24 h of reperfusion after 2 h of MCAO in groups with no transfusion or transfusion of PEG-albumin or PEG-COHb at 20 min of MCAO (mean ± SE; n = 10). *P < 0.05 between PEG-COHb groups versus no transfusion and PEG-albumin groups.
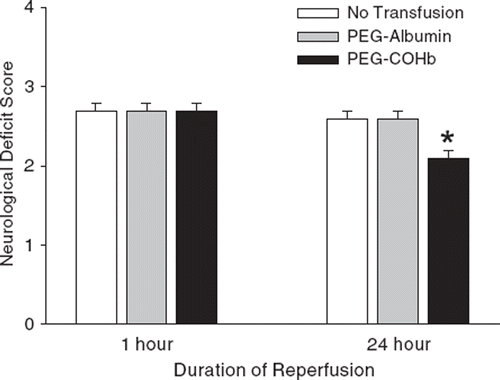
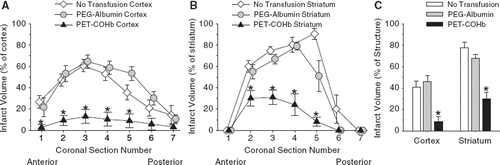
Figure 3. Infarct volume in each of the 7 coronal sections for cerebral cortex (A) and striatum (B), and total infarct volume summed over the 7 sections for cerebral cortex and striatum (C). Values are expressed as a percent of the contralateral total structure (means ± SE; n = 10). *P < 0.05 between PEG-COHb group versus no transfusion and PEG-albumin groups.