Figures & data
Figure 1. The experimental protocol of this study. After 30 mins of basal perfusion, the pre-HBOCs and STS groups’ hearts were arrested by STS with or without 0.1 gHb/dL PolyPHb, then subjected to 45 mins of ischemia at 37°C and 2 hrs of reperfusion. Hearts perfused with Krebs-Henseleit buffer for 2.5 hrs without ischemia were used as sham control. STS: St.Thomas’ solution.
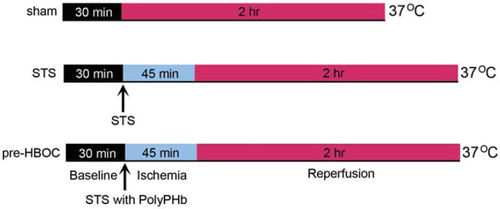
Figure 2. Myocardial apoptosis determined by TUNEL staining. Representative TUNEL-stained myocardial sections were shown at the top. Arrows indicate the locations of myocardial apoptosis. Values are presented as mean ± SD (n = 10). **P < 0.01 vs. the STS group.
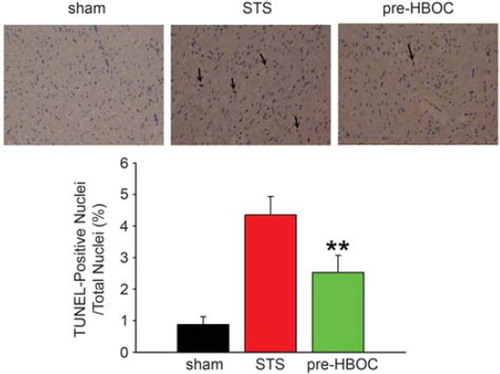
Figure 3. The caspase-3 activity of three group hearts. Values are presented as mean ± SD (n = 10). *P < 0.05 vs. the STS group.
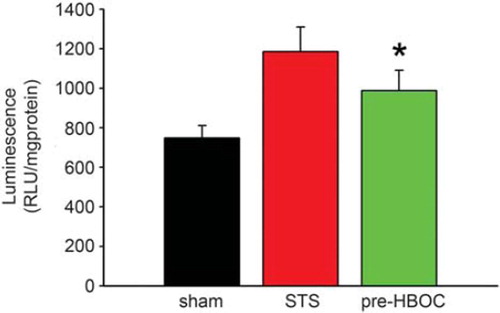
Figure 4. Western blot analysis of apoptosis-related protein caspase-3. Representative results of caspase-3 cleavage are shown at the top, β-actin is used as internal control. Values are normalized to the sham group and expressed as mean ± SD (n = 5). *P < 0.05 vs. the STS group.
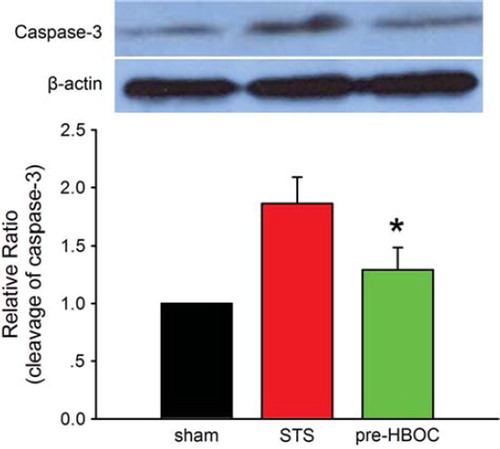
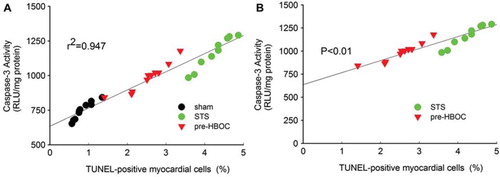
Figure 5. The linear regression analysis of the myocardial apoptosis and caspase-3 activity.