Figures & data
Figure 1. Characterization of EPC cell cultures. Peripheral blood mononuclear cells (PBMCs) were incubated in EBM for 5 days, stained with DiLDLD and FITC-lectin, and analyzed using flow cytometry. Double-positive cells are considered to be EPCs. Cell cultures with an EPC fraction of at least 90% were used for all experiments (representative dot plot is shown).
Figure 2. EPC adhesion on HUVECs after short-term PMA activation. EPCs were co-cultured on HUVECs for 1 hour, and nonadhered cells were removed by washing co-cultures 3 times with PBS+/+. Photos show representative fields of view (×200 magnification) of DiLDL-positive cells. Graph shows adhesion of EPCs on HUVECs after short-term PMA activation with different concentrations (n = 6). Stars indicate significant difference vs. control; for p < 0.05 groups were considered to be significantly different.
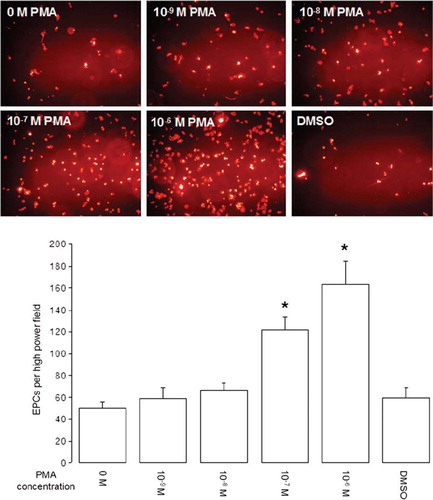
Figure 3. EPC adhesion on extracellular matrix after short-term PMA activation. EPCs were incubated on fibronectin, collagen or laminin for 1 hour, and nonadhered cells were removed by washing plates 3 times with PBS+/+. Photos show representative fields of view (×200 magnitude) of EPC adhering to laminin. Graph a shows EPC adhesion to fibronectin, Graph b shows EPC adhesion to laminin, and Graph c shows EPC adhesion to collagen (all experiments n = 6). Stars indicate significant difference vs. control; for p < 0.05 groups were considered to be significantly different.
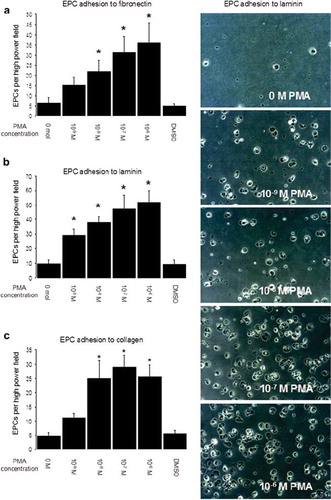
Figure 4. Apoptosis and necrosis of EPCs after short-term PMA activation. EPCs were activated with different PMA con centrations for 15 minutes, after which cells were washed 3 times with PBS+/+ and incubated for a further 3 or 24 hours in EBM. Apoptosis and necrosis was determined by propidium iodide (PI) and annexin-V-FITC staining. Necrotic (PI-positive cells), late apoptotic (double-stained cells) and early apoptotic (annexin-V-FITC-positive cells) cells were determined by flow cytometry (representative dot plots after 3 hours are shown, fig. 4a). To determine the dead cell fraction, necrotic, early, and late apoptotic cell fractions were summed up. Figure 4b shows dead cell fractions 3 and 24 hour after short-term PMA stimulation. Figure 4c shows EPCs per high power field before collection for flowcytometric necrosis/apoptosis analysis (all experiments n = 6). Stars indicate significant differences between groups; for p < 0.05 groups were considered to be sig nificantly different.
Figure 5. EPC differentiation after short-term PMA activation. EPCs were activated with different PMA concentrations for 15 minutes, after which cells were washed 3 times with PBS+/+ and incubated for a further 3 days in EBM. Gene expression of vWF was then measured using RT-PCR, and DiLDL uptake was determined using flow cytometry. Figure 5 shows representative lanes for GAPDH and vWF expression (n = 3), and the graph shows mean DiLDL fluorescence intensity in EPCs from 4 experiments.