Figures & data
Figure 1. Effect of PolyPHb and PolyPHb + CAT + SOD on ST-wave change in ECG. Values were expressed as mean ± SEM (n = 20). *P < 0.05 vs control group.
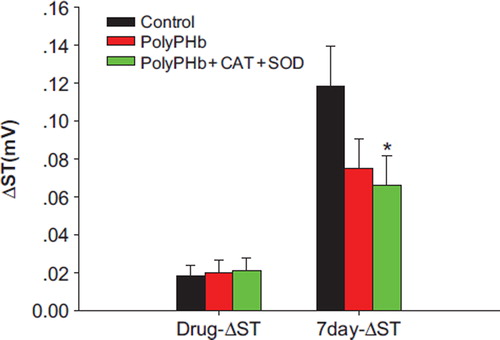
Figure 2. The total cTnT release of 3 groups after 24 hours of MI. Values were expressed as mean ± SEM (n = 20). *P < 0.05, **P < 0.01 vs control group.
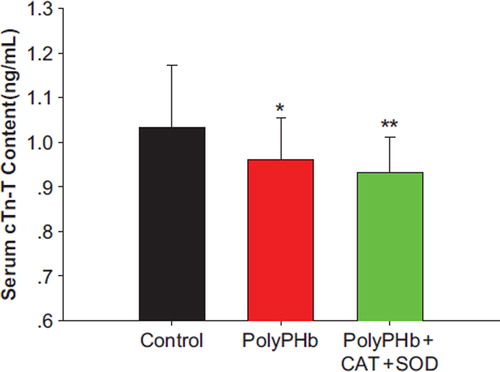
Figure 3. Myocardial infarct size determined by NBT staining. Normal myocardium stained dark blue within 15 min, while the infarcts remained unstained or stained only faintly. NBT staining in control group (A); treated with PolyPHb group (B); treated with PolyPHb + CAT +SOD (C); and the percentage of myocardial infarct size (D). Values were expressed as mean ± SEM(n = 10). *P < 0.05 vs control group.
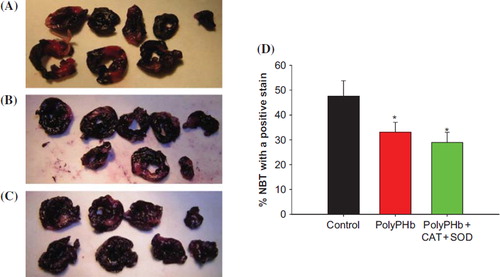
Figure 4. The statistical analysis of the HE-stained cardiac section (n = 10). The pathological picture in control group (B); treated with PolyPHb group (C); treated with PolyPHb + CAT + SOD (D); and the pathological scores (A). The pathological scores of the PolyPHb + CAT + SOD group were markedly reduced compared with the scores of the control group. Values were presented as mean ± SEM (n = 6). *P < 0.05, **P < 0.01 vs control group.
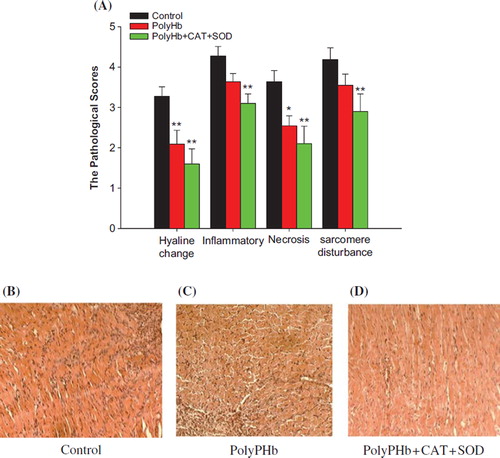
Figure 5. Ischemia changes of cardiomyocytes determined by HBFP staining. Ischemic heart muscle, RBCs, collagen tissue stained with crimson red, while other tissues and structures stained with yellow. The HBFP staining picture in control group (B); in PolyPHb treated group (C); in PolyPHb + CAT + SOD treated group (D); and the pathological scores (A). Values were expressed as mean ± SEM (n = 10). *P < 0.05, **P < 0.01 vs control group. ##P < 0.01 vs PolyPHb group.
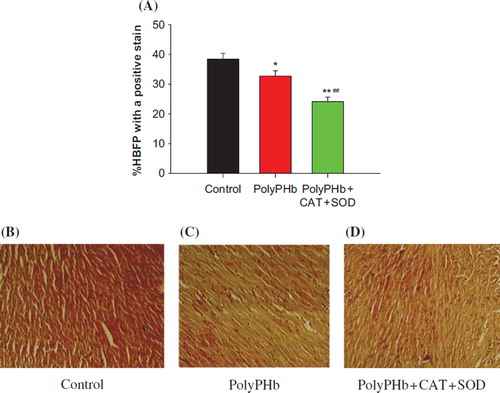
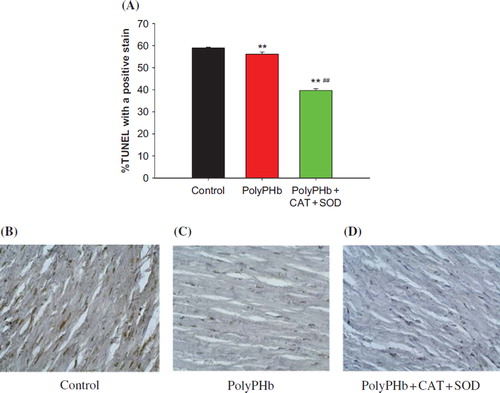
Figure 6. Apoptotic cells of cardiomyocytes determined by TUNEL staining. TUNEL detection in control group (B); in the group treated with PolyPHb (C); in the group treated with PolyPHb + CAT + SOD (D); and TUNEL positive cells ratio (A). The number of TUNEL positive vs control group when treatment with PolyPHb and PolyPHb + CAT + SOD at MI decreased. Values were expressed as mean ± SEM (n = 10). **P < 0.01 vs control group, ##P < 0.01 vs PolyPHb group.