508
Views
3
CrossRef citations to date
0
Altmetric
Research Article

Pre-hospital Resuscitation with HBOC-201 and rFVIIa Compared to HBOC-201 Alone in Uncontrolled Hemorrhagic Shock in Swine

, , , , , , , , & show all
Pages 44-55 | Published online: 02 Aug 2011

Figures & data

Figure 1. Survival is increased but not statistically significant in the HBOC-201 group up to 2 hours (Figure 1a) and at 72 hours (Figure 1b) compared to the HBOC + rFVIIa group. No animal in the NON group lived to 72 hours.
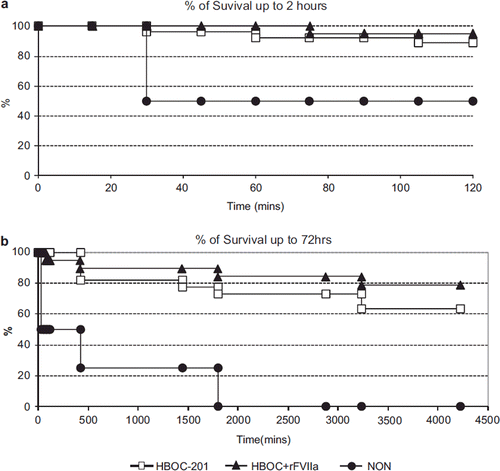
Figure 1. Survival is increased but not statistically significant in the HBOC-201 group up to 2 hours (Figure 1a) and at 72 hours (Figure 1b) compared to the HBOC + rFVIIa group. No animal in the NON group lived to 72 hours.

Figure 2. The percent loss of estimated blood volume (EBV) () at T15 was 42%, 40%, and 60% for HBOC-201, HBOC + rFVIIa, and NON group, respectively (p = 0.002 HBOC + rFVIIa vs. NON). There was no statistical difference in percent loss of EBV () between the HBOC-201 and the HBOC + rFVIIa at hospital arrival T60 (79% and 78% p = 0.98).
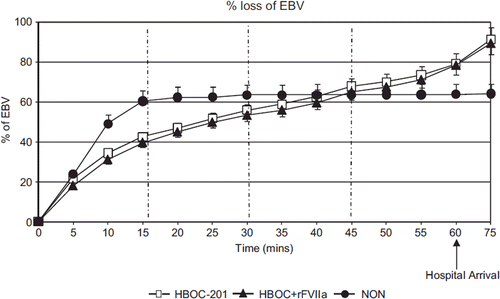
Figure 2. The percent loss of estimated blood volume (EBV) (Figure 2) at T15 was 42%, 40%, and 60% for HBOC-201, HBOC + rFVIIa, and NON group, respectively (p = 0.002 HBOC + rFVIIa vs. NON). There was no statistical difference in percent loss of EBV (Figure 2) between the HBOC-201 and the HBOC + rFVIIa at hospital arrival T60 (79% and 78% p = 0.98).

Figure 3. Transcutaneous oxygenation saturation (tcpO2) (Figure 3a), O2 delivery (DO2) (Figure 3b), and O2 extraction ratio (O2ER) (Figure 3c) were the same in both HBOC-201 and HBOC + rFVIIa groups, but significantly improved in both groups compared to NON (p = 0.007).
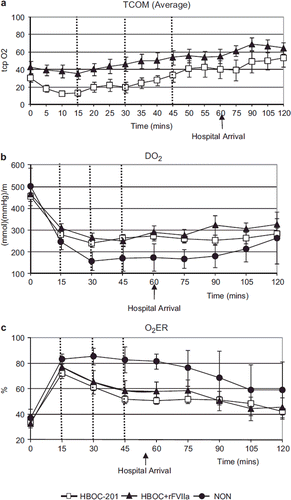
Figure 3. Transcutaneous oxygenation saturation (tcpO2) (Figure 3a), O2 delivery (DO2) (Figure 3b), and O2 extraction ratio (O2ER) (Figure 3c) were the same in both HBOC-201 and HBOC + rFVIIa groups, but significantly improved in both groups compared to NON (p = 0.007).

Figure 4. Lactate clearance (Figure 4a), HCO3 (Figure 4b), and BE (Figure 4c) were similar over time in both HBOC-201 and HBOC + rFVIIa groups and were significantly lower in NON animals compared to the other groups (p < 0.0001).
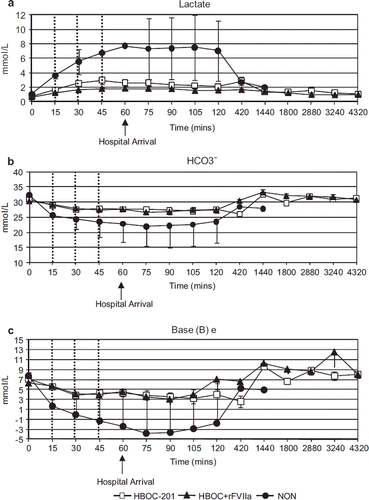
Figure 4. Lactate clearance (Figure 4a), HCO3− (Figure 4b), and BE (Figure 4c) were similar over time in both HBOC-201 and HBOC + rFVIIa groups and were significantly lower in NON animals compared to the other groups (p < 0.0001).

Figure 5. HR (Figure 5c) increased in all groups in response to hemorrhage and began to normalize at 60 minutes. MAP (Figure 5a), MPAP (Figure 5b), and CI (Figure 5d) was similar over time in both HBOC-201 and HBOC + rFVIIa groups and was significantly lower in NON animals compared to the other groups [MAP, (p < 0.0001)].

Figure 5. HR (Figure 5c) increased in all groups in response to hemorrhage and began to normalize at 60 minutes. MAP (Figure 5a), MPAP (Figure 5b), and CI (Figure 5d) was similar over time in both HBOC-201 and HBOC + rFVIIa groups and was significantly lower in NON animals compared to the other groups [MAP, (p < 0.0001)].

Table 1. Parameters measured in swine treated with HBOC-201 or HBOC + rFVIIa during the experiment.

Reprints and Corporate Permissions

Please note: Selecting permissions does not provide access to the full text of the article, please see our help page How do I view content?

To request a reprint or corporate permissions for this article, please click on the relevant link below:

Academic Permissions

Please note: Selecting permissions does not provide access to the full text of the article, please see our help page How do I view content?

Obtain permissions instantly via Rightslink by clicking on the button below:

If you are unable to obtain permissions via Rightslink, please complete and submit this Permissions form. For more information, please visit our Permissions help page.