Figures & data
Figure 1. Purified pig islets after dithiozone staining and FACS analysis of freshly isolated purified porcine islets. a) Purified pig islets stained with dithiozone (original magnification 100x). b) Porcine islets (1500 IEQ/ml) were dispersed by incubating in accutase. Isolated cells were loaded with Newport-Green (NG) for beta-cell identification and with Propidium Iodide for discrimination of viable/dead cells. Dead beta-cells are found in the upper right quadrant of the dot-plot. Viable beta-cells are present in the lower right quadrant showing a bold population of living beta-cells. Percent values indicate the ratio of dots present in the indicated quadrants.
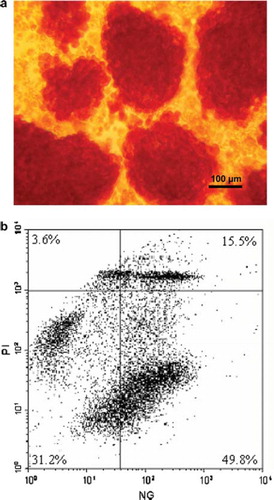
Figure 2. Histogram analysis of dissociated porcine beta-islet cells. Islets (1500 IEQ/ml) were cultured for 24h in HAMS-F12 at 4°C. Islets were co-incubated with cytokines (IL1ß and TNFα, 10 ng/ml each) or PK11195 at a concentration of 100μM. Islets were dissociated by accutase incubation and analyzed by FACS. M1 denote the proportion of viable beta-cells.
Figure 3. Histogram analysis of dissociated human beta-islet cells. Islets were cultured for 24h in RL/HA at 4°C. Islets were co-incubated with cytokines (IL1ß and TNFα, 10 ng/ml each) or PK11195 at a concentration of 100 μM. Islets were dissociated by accutase incubation and analyzed by FACS. M1 denote proportion of viable beta-cells.
Figure 4. Effect of PBR-ligands and cytokines on the viability of pig (n = 4) and human islets (n = 5) determined in FACS analysis. Values are given in percentage. Cyt: supplementation of cell culture medium with a combination of IL1ß and TNFα at a final concentration of 10 ng/ml each; Ro: supplementation of cell culture medium with Ro5-4864 at a final concentration of 100 μM; PK: supplementation of cell culture medium with PK11195 at a final concentration of 100μM. *:P < 0.01 for comparison of Cyt vs. control, Cyt vs PK and Cyt vs PK + Cyt after performing repeated measures ANOVA with Dunnett multiple comparision test.