Figures & data
Figure 1. (a) Schematic depiction of the wet spinning process. (b) Procedure for creation of a capillary-like network in agarose gel.
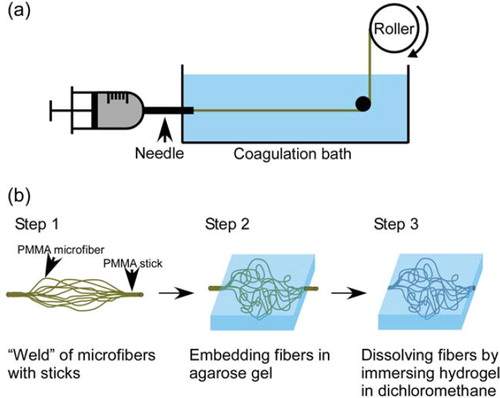
Figure 2. Dependence of the diameter of PMMA microfibers on take-up rate. The data (actual diameter) represent mean values (n > 100) and the bars show standard deviations.
Figure 3. Scanning electron microscopic image of PMMA microfibers prepared with take-up rate 31.0 cm s−1. Scale bar: 20 μm.
Figure 4. Capillary-like network in agarose gel injected with India ink through the inlet macrochannel. (a)-(d) Progressive perfusion of the ink throughout the network; (e) magnified image of (d). Arrowheads show microchannels. Scale bars in (a)-(d) and (e): 1 cm and 500 μm, respectively.