Figures & data
Figure 1. Confocal microscopic images of Caco-2 cells after 1 h incubation with OAE-VD3-FITC at 37°C, which were imaged by (a) DAPI channel, (b) FITC channel and (c) the combined DAPI channel and FITC channel, respectively.
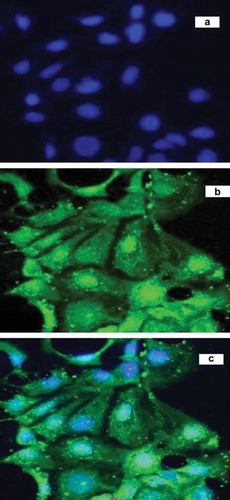
Figure 2. The mean serum concentration-time curve of VD3 and OAE-VD3 in mice after a single oral dose (2mg/kg) of VD3 and OAE-VD3. Each data represents the mean ± S.D. of 6 rats.
Table 1. Pharmacokinetic parameters of VD3 and OAE-VD3 in mice serum (n = 6).
Table 2. Changes of body weight (n = 6).
Table 3. Changes of serum parameters (n = 6).
Table 4. Changes of the content of calcium and phosphorus in rat tibia (n = 6).
Table 5. Changes of mineral density in rat femur (n = 6).
Figure 3. Femoral radiological changes.
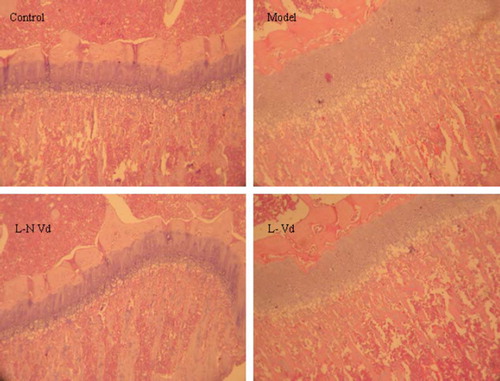
Figure 4. Histological changes in femur (HE staining, ×400).